Note
Go to the end to download the full example code.
Generator outage and unequal intervals#
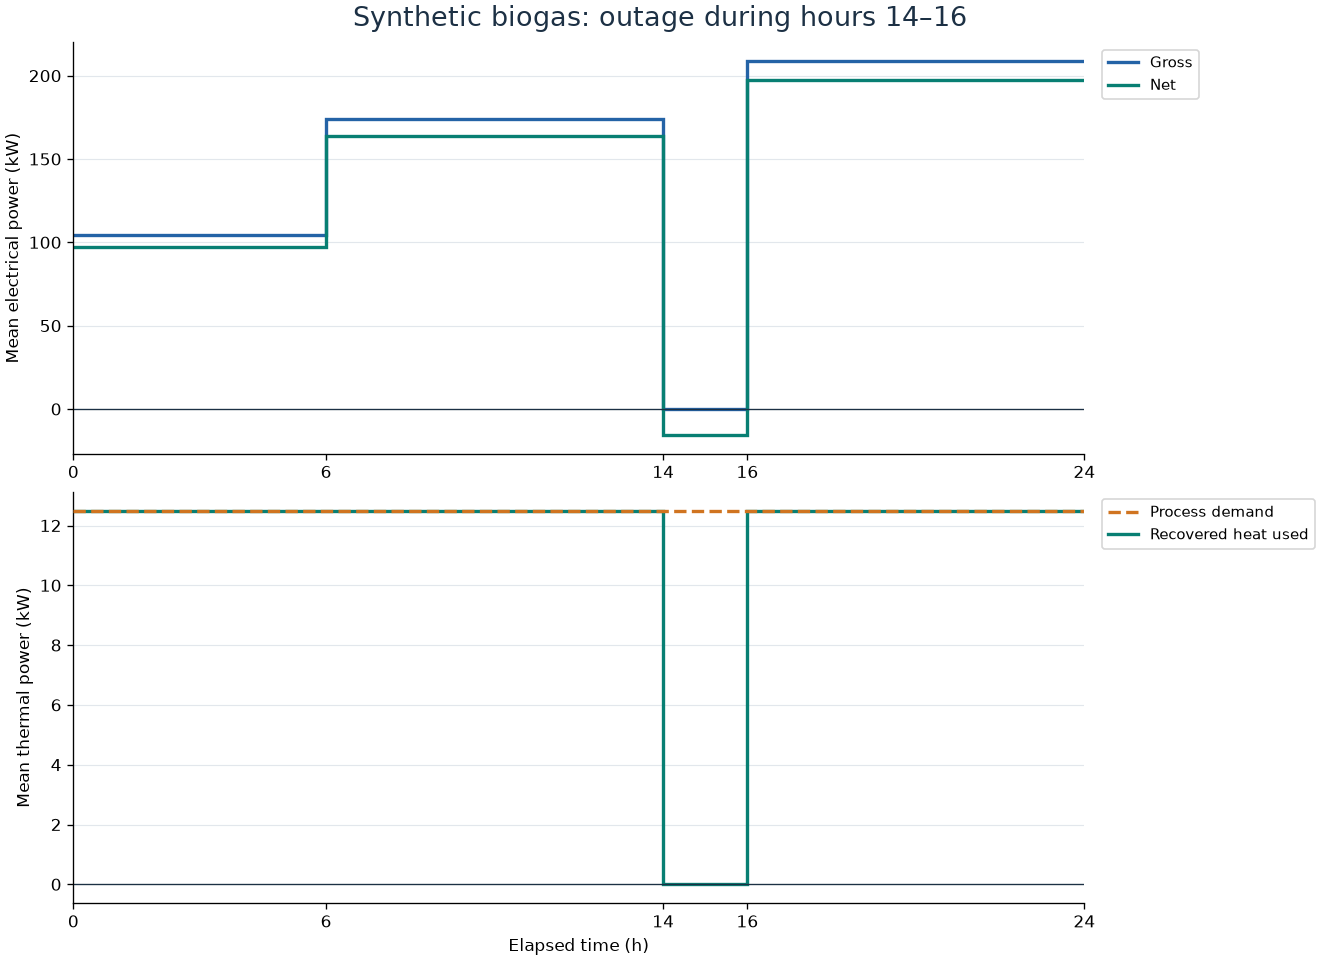
Interval powers are plotted against actual elapsed time. The generator is unavailable from hour 14 to 16, while feed processing and standing loads continue. There is no assumed gas storage or rescheduling of unused fuel.
from x2power.methods.profile import OperatingInterval, simulate_profile, summarize_profile
from x2power.utilities.plotting import plot_profile
The base feed is 2000 dry normal cubic metres over 24 hours. Profile intervals scale this average flow and independently specify generator availability.
scenario = {
    "schema_version": 1,
    "route": "biogas",
    "duration_h": 24,
    "feedstock": {"volume_nm3": 2000, "methane_fraction": 0.6},
    "process": {"process_heat_kwh": 300},
    "generator": {"electrical_efficiency": 0.35, "heat_recovery_efficiency": 0.4},
    "auxiliaries": {"fixed_power_kw": 3, "electricity_fraction_of_gross": 0.04},
}
intervals = [
    OperatingInterval(6, feed_rate_multiplier=0.6),
    OperatingInterval(8),
    OperatingInterval(2, availability=0),
    OperatingInterval(8, feed_rate_multiplier=1.2),
]
results = simulate_profile(scenario, intervals)
summary = summarize_profile(results)
print(f"Total net electricity: {summary['net_electricity_kwh']:.1f} kWh")
print(f"Mean net power: {summary['mean_net_power_kw']:.1f} kW")
Total net electricity: 3443.2 kWh
Mean net power: 143.5 kW
Negative output during the outage represents the external electricity needed to keep the declared loads and heat supply operating.
figure = plot_profile(results, title="Synthetic biogas: outage during hours 14–16")
Total running time of the script: (0 minutes 0.106 seconds)