Note
Go to the end to download the full example code.
Space-power components and installation evidence#
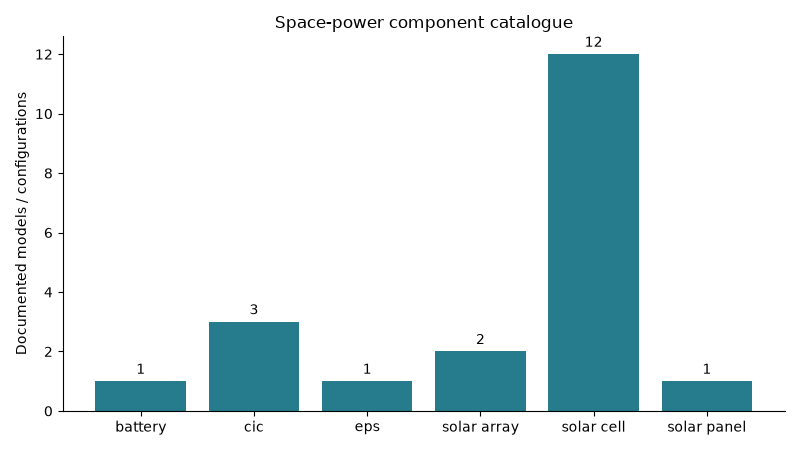
Count actual component categories and resolve documented spacecraft links. Component ratings are not summed: a cell efficiency, an array’s W and a battery’s Wh differ.
DART -> Deployable Space Systems ROSA
Europa Clipper -> Airbus Netherlands B.V. Europa Clipper solar array system
SPACE HAUC -> EnduroSat 3U Solar Panel
SPACE HAUC -> GomSpace NanoPower BP4
SPACE HAUC -> GomSpace NanoPower P31u
from collections import Counter

import matplotlib.pyplot as plt

from orbitalpv import catalogue

components = catalogue.load_records("components")
lookup = {row["record_id"]: row for row in components}
for satellite in catalogue.load_records("satellites"):
    for identifier in satellite.get("component_ids", []):
        print(f"{satellite['name']} -> {lookup[identifier]['name']}")

counts = Counter(row["component_type"] for row in components)
labels = sorted(counts)
fig, ax = plt.subplots(figsize=(8, 4.5))
bars = ax.bar(
    [label.replace("_", " ") for label in labels],
    [counts[label] for label in labels],
    color="#267c8c",
)
ax.bar_label(bars, padding=3)
ax.set(ylabel="Documented models / configurations", title="Space-power component catalogue")
ax.spines[["top", "right"]].set_visible(False)
fig.tight_layout()
plt.show()
Total running time of the script: (0 minutes 0.096 seconds)