Real on-orbit data#
These examples retrieve and analyze public spacecraft telemetry rather than synthetic data.
Connector workflows#
Every walkthrough calls the public orbitalpv API and includes measured
coverage, source attribution, units and step-by-step figures. First runs
retrieve public files or API responses; later runs reuse local snapshots.
Source |
What is measured |
Example scope |
|---|---|---|
Flying Laptop |
Solar-array voltage and current; calculated V×I |
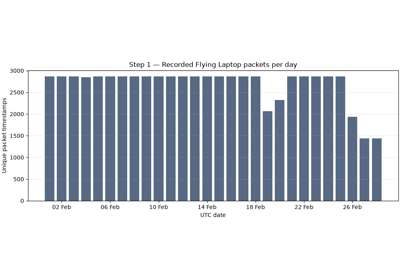
A month, 75,097 packet times and four arrays |
OPS-SAT-AD |
Photodiode/magnetometer signals and expert annotations |
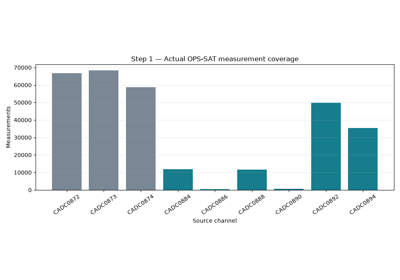
303,493 values in 2,123 source segments |
TSIS-1 / SORCE TIM |
Total solar irradiance and uncertainty |
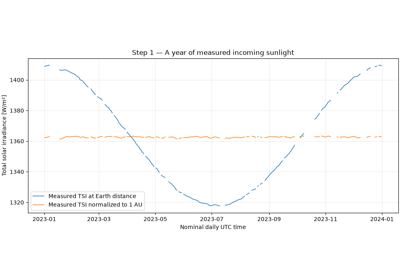
Annual history and instrument overlap, with missing bins preserved |
TSIS-1 SIM |
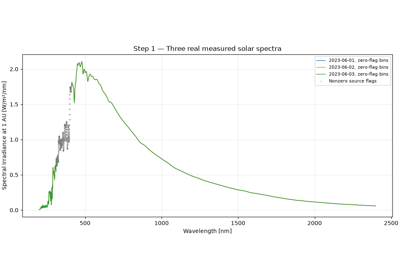
Wavelength-resolved solar irradiance and quality flags |
Three daily spectra, 2,104 wavelengths each |
NOAA GOES |
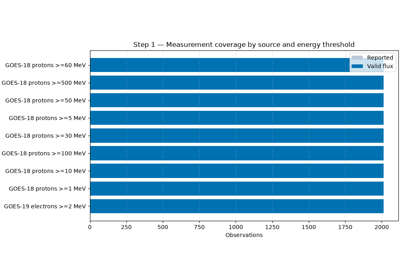
Integral proton/electron particle flux |
Seven-day measured environment snapshot |
BIRDS |
Panel voltage, current and temperature |
Four spacecraft and 48 flight campaigns |
Install pip install -U "orbital-pv[excel,examples]>=0.5.0". Flying Laptop
downloads approximately 30 MB and OPS-SAT approximately 19 MB once. Irradiance
and GOES examples request bounded subsets. The examples state when power is
computed from measured V/I or when a modeled PV response uses measured input.
For a held-out empirical reference comparison using the Flying Laptop measurements, see Flying Laptop reference gap. It reports signed power gaps, sampling coverage and observed-time energy while leaving physical causes unexplained when the required evidence is unavailable.
BIRDS campaign details#
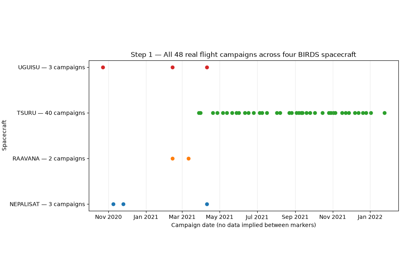
The BIRDS workflow uses measured solar-panel voltage, current and temperature from four 1U CubeSats: RAAVANA, UGUISU, NEPALISAT and TSURU. The source workbooks contain 48 flight campaigns, 31,725 measurement times and 158,625 panel observations. Each measurement time is counted within its spacecraft and campaign and contains five panel observations.
The walkthrough retains its original RAAVANA example address and includes:
an overview of all four spacecraft and their measurement coverage;
full-resolution plots of RAAVANA’s two approximately 90-minute campaigns, containing 1,079 and 1,080 measurements at five-second intervals;
five-minute power envelopes within each recorded campaign;
TSURU’s longer history of 40 flight campaigns.
TSURU’s two undated test sheets, Test1 w batt and Test2 wo batt, are
excluded. Its yearless March–December sheets use an explicitly inferred
campaign_year=2021, followed by the sheets explicitly dated January 2022.
This inference is consistent with TSURU’s 14 March 2021 deployment. The
normalized timestamps are campaign-date anchors plus recorded elapsed
seconds; the actual UTC session start is unknown. The example does not
interpolate measurements across campaign gaps or claim precise UTC timing.
The dataset is published by Jara and Lepcha (2022), DOI 10.17632/8kp25ycf63.1, under CC BY 4.0. Counts refer to the official source workbooks; the associated article describes the instrumentation and collection method.
Install the workbook reader and plotting dependencies with
pip install -U "orbital-pv[excel,examples]>=0.4.2". The first run downloads the
upstream workbooks and requires network access; subsequent runs reuse the
downloaded files. The public opv.fetch_birds_eps and
opv.load_birds_eps_workbook helpers both accept campaign_year=2021
for the TSURU yearless campaign names.
Solar activity: sunlight, X-rays and geomagnetic context
Free spacecraft research APIs: evidence, archives and geometry
Flying Laptop: a month of measured solar-array generation
OPS-SAT photodiodes: real signals and expert annotations