Note
Go to the end to download the full example code.
Solar activity: sunlight, X-rays and geomagnetic context#
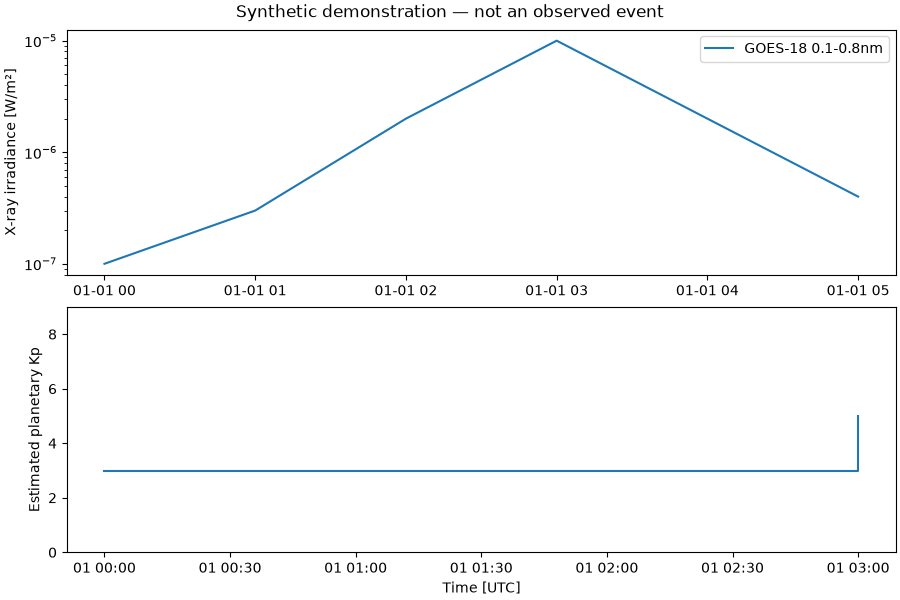
An offline, explicitly illustrative example of the NOAA normalization API. These synthetic values demonstrate separate physical quantities; they are not an observed solar storm. Set ORBITALPV_LIVE_SOLAR=1 to fetch rolling NOAA feeds. For measured broadband/spectral sunlight use LisirdConnector (see guide). No storm index is converted into PV degradation or electrical losses.
import os

import matplotlib.pyplot as plt

from orbitalpv import NoaaSwpcConnector, normalize_solar_activity

if os.environ.get("ORBITALPV_LIVE_SOLAR") == "1":
    with NoaaSwpcConnector() as connector:
        xrays = connector.solar_activity("xrays")
        kp = connector.solar_activity("kp")
        alerts = connector.solar_activity("alerts")
    label = "Live rolling NOAA observations (different sampling cadences)"
    print(f"Retrieved {len(alerts)} bulletins; inspect issue times and message text.")
else:
    xrays = normalize_solar_activity(
        [
            {
                "time_tag": f"2026-01-01T{hour:02}:00:00Z",
                "satellite": 18,
                "energy": "0.1-0.8nm",
                "electron_contaminaton": False,
                "flux": flux,
            }
            for hour, flux in enumerate([1e-7, 3e-7, 2e-6, 1e-5, 2e-6, 4e-7])
        ],
        "xrays",
    )
    kp = normalize_solar_activity(
        [
            ["time_tag", "Kp"],
            ["2026-01-01 00:00:00", "3"],
            ["2026-01-01 03:00:00", "5"],
        ],
        "kp",
    )
    label = "Synthetic demonstration — not an observed event"

fig, axes = plt.subplots(2, 1, figsize=(9, 6), layout="constrained")
for _, group in xrays.groupby(["satellite", "energy"]):
    satellite, band = group["satellite"].iloc[0], group["energy"].iloc[0]
    axes[0].semilogy(
        group.timestamp,
        group.flux_w_m2.where(group.flux_w_m2.gt(0) & group.quality_good),
        label=f"GOES-{satellite} {band}",
    )
axes[0].set_ylabel("X-ray irradiance [W/m²]")
if not xrays.empty:
    axes[0].legend()
axes[1].step(kp.timestamp, kp.kp, where="post")
axes[1].set(ylim=(0, 9), ylabel="Estimated planetary Kp", xlabel="Time [UTC]")
fig.suptitle(label)
plt.show()
Total running time of the script: (0 minutes 0.221 seconds)