Note
Go to the end to download the full example code.
Does more solar power unlock continuous payload capacity?#
NASA’s November 2, 2026 update describes the final solar-array installation planned for November 5. Its approximate 160 and 215 kW capacity figures motivate the scales below; they are NOT measured sunlit bus power or an ISS power budget. Source: https://www.nasa.gov/blogs/spacestation/2026/11/02/week-starts-with-spacewalk-preps-and-life-science/
Decision: should a station operator upgrade PV alone or also storage to support continuous loads? All battery, orbit and operating assumptions below are modeled. The bound assumes repeated identical sunlight/eclipse intervals and no aging. It represents total continuous bus load; subtract essential loads and reserves before interpreting any remainder as payload capacity.
from pathlib import Path

import matplotlib.pyplot as plt
import numpy as np

from orbitalpv.data import load_table
from orbitalpv.physics import BatterySpec, dispatch_power, periodic_load_limit

directory = Path(__file__).resolve().parent if "__file__" in globals() else Path.cwd()
cases = load_table(directory / "_data/array_upgrade_cases.csv")
limits = []
fig, axes = plt.subplots(1, 2, figsize=(11, 4.8))
for row in cases.to_dict("records"):
    battery = BatterySpec(
        capacity_wh=row["nominal_battery_wh"],
        initial_soc=0.2,
        minimum_soc=0.2,
        maximum_soc=0.9,
        max_charge_w=200000,
        max_discharge_w=200000,
    )
    limit = periodic_load_limit(row["sunlit_power_w"], 1, 35 / 60, battery=battery)[
        "sustainable_load_w"
    ]
    limits.append(limit / 1000)
    edges = np.array([0, 3600, 5700, 9300, 11400])
    dispatch = dispatch_power(
        edges, [row["sunlit_power_w"], 0, row["sunlit_power_w"], 0], limit, battery=battery
    )
    assert dispatch.unserved_load_w.max() < 1e-8
    assert dispatch.soc_end.iloc[-1] >= battery.initial_soc - 1e-10
    axes[1].plot(
        edges / 3600,
        np.r_[battery.initial_soc, dispatch.soc_end],
        marker="o",
        label=row["scenario"],
    )
    print(f"{row['scenario']}: {limit / 1000:.2f} kW sustainable total bus load")
axes[0].bar(cases.scenario, limits, color=["#167d9a", "#e7ae4c", "#5a9461"])
axes[0].set(ylabel="Continuous bus power [kW]", title="Modeled upgrade benefit")
axes[0].tick_params(axis="x", labelrotation=18)
axes[1].set(
    xlabel="Time [h]", ylabel="State of charge", title="Independent dispatch check: two cycles"
)
axes[1].legend(fontsize=8)
fig.tight_layout()
plt.show()
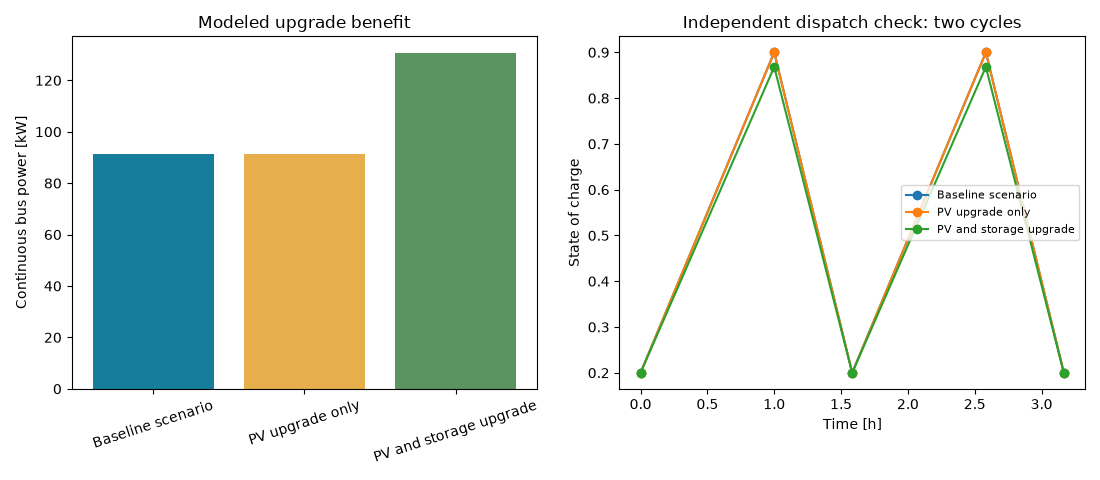
Baseline scenario: 91.20 kW sustainable total bus load
PV upgrade only: 91.20 kW sustainable total bus load
PV and storage upgrade: 130.59 kW sustainable total bus load
fig, ax = plt.subplots(figsize=(8, 5))
for eclipse_min in (20, 35, 45):
    for pv_kw in (160, 215):
        capacities = np.linspace(40, 160, 61)
        power = [
            periodic_load_limit(
                pv_kw * 1000,
                1,
                eclipse_min / 60,
                battery=BatterySpec(
                    capacity_wh=float(c) * 1000,
                    minimum_soc=0.2,
                    maximum_soc=0.9,
                    max_charge_w=200000,
                    max_discharge_w=200000,
                ),
            )["sustainable_load_w"]
            / 1000
            for c in capacities
        ]
        ax.plot(
            capacities,
            power,
            linestyle="-" if pv_kw == 215 else "--",
            label=f"{pv_kw} kW PV; {eclipse_min} min eclipse",
        )
ax.set(
    xlabel="Nominal battery capacity [kWh]",
    ylabel="Sustainable constant bus load [kW]",
    title="Modeled storage bottleneck and eclipse sensitivity",
)
ax.legend(fontsize=8)
ax.grid(alpha=0.2)
fig.tight_layout()
plt.show()
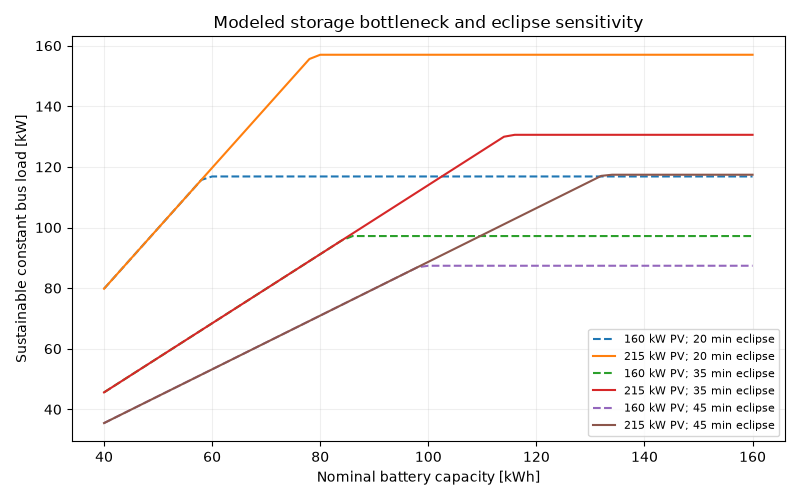
PV-only increases sustainable power by zero kW in this 80 kWh battery scenario. Increasing modeled storage to 120 kWh unlocks the higher orbit-energy bound. This is capacity screening, not an economic recommendation or an ISS forecast. Real decisions require measured generation, essential loads, aging, redundant channels, thermal/power limits, reserve policy, deployment risk and actual costs.
Total running time of the script: (0 minutes 0.331 seconds)