Note
Go to the end to download the full example code.
InSight: observed energy, atmospheric dust and panel soiling#
Fit one amplitude to sols 5–39 and compare on sols 40–200. The panel-dust rate is fixed from Lorenz et al. (2020). This is a retrospective, same-mission comparison, not independent validation or a weather forecast. Four early sols lack bracketing opacity observations and are retained without predictions.
The 600-nm opacity comes from the provider-linked PDS review tree. Operational energy is estimated from current/voltage fits, not continuous wattmeter data.
import importlib.util
from pathlib import Path

import matplotlib.pyplot as plt

from orbitalpv import mars

directory = Path(__file__).resolve().parent if "__file__" in globals() else Path.cwd()
root = directory.parents[1]
spec = importlib.util.spec_from_file_location(
    "mars_comparison", root / "analysis/mars_surface_pv/run.py"
)
assert spec is not None and spec.loader is not None
analysis = importlib.util.module_from_spec(spec)
spec.loader.exec_module(analysis)
frame, summary = analysis.compare()
print(
    "Later-sol energy comparison:", summary["models"]["geometry_atmosphere_panel_dust"]["holdout"]
)

fig, axes = plt.subplots(3, 1, figsize=(10, 10), sharex=True, layout="constrained")
axes[0].scatter(
    frame.sol,
    frame.estimated_array_energy_wh / 1000,
    s=12,
    color="#283747",
    label="Published operational estimates",
)
for column, label, color in [
    ("geometry_atmosphere_panel_dust_wh", "Geometry + atmosphere + panel dust", "#c35b36"),
    ("geometry_atmosphere_wh", "Without panel dust", "#3b8ea5"),
    ("geometry_only_wh", "Geometry only", "#9a8e75"),
]:
    axes[0].plot(frame.sol, frame[column] / 1000, label=label, color=color)
axes[0].set(
    ylabel="Array energy (kWh/sol)",
    title="InSight: adding panel dust markedly improves the baseline",
)
axes[0].legend(fontsize=8, loc="upper right")
axes[1].plot(
    frame.sol,
    frame.tau_600nm_interpolated,
    color="#c35b36",
    label="Interpolated camera opacity at 600 nm",
)
axes[1].plot(
    frame.sol,
    frame.array_dust_factor_scenario,
    color="#3b8ea5",
    label="Panel retention scenario: 0.28% loss/sol",
)
axes[1].set(ylabel="Optical depth / retention")
axes[1].legend(fontsize=8)
residual = frame.geometry_atmosphere_panel_dust_wh - frame.estimated_array_energy_wh
axes[2].plot(frame.sol, residual, color="#c35b36")
axes[2].axhline(0, color="black", lw=0.8)
axes[2].set(
    ylabel="Model minus estimate (Wh)",
    xlabel="InSight mission sol",
    title="Held-out RMSE: 290 Wh/sol (10.2% of mean); persistent positive bias remains",
)
for ax in axes:
    ax.axvspan(5, 39, color="#eadbc8", alpha=0.45)
    ax.axvline(39.5, color="#777777", lw=0.8, ls="--")
    ax.grid(alpha=0.15)
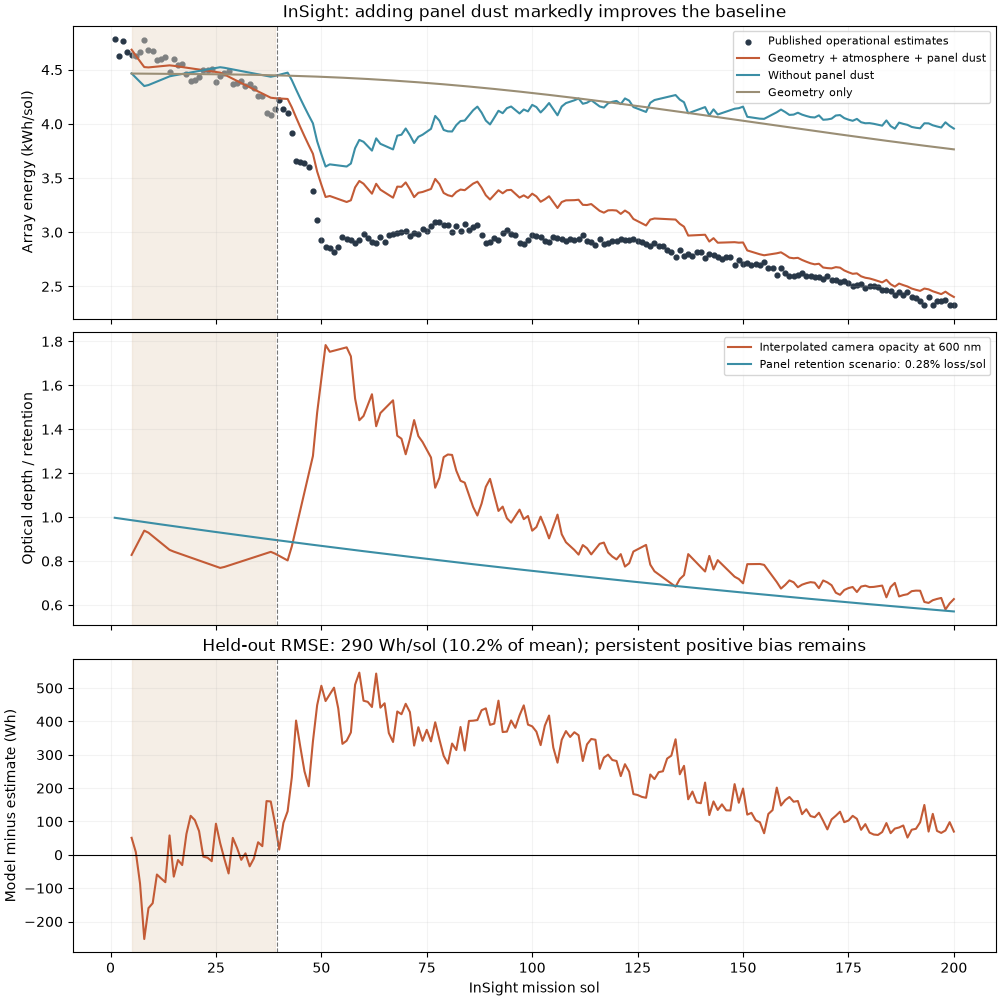
Later-sol energy comparison: {'n': 161, 'mae_wh': 255.02240265778667, 'rmse_wh': 289.5157003784316, 'bias_wh': 255.02240265778667, 'nrmse_pct_of_mean': 10.16829507647859}
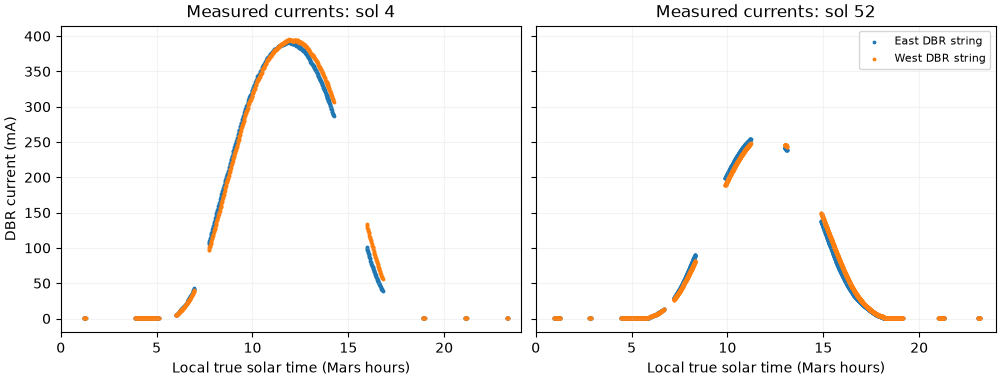
Native string currents retain sleep gaps. They are neither total array current nor a complete daily power record, so they are not integrated.
fig, axes = plt.subplots(1, 2, figsize=(10, 3.8), sharey=True, layout="constrained")
for ax, sol in zip(axes, [4, 52], strict=True):
    path = analysis.DATA / f"Solar_{sol:05d}-{sol:05d}.txt"
    currents = mars.parse_insight_currents(path.read_bytes())
    ax.scatter(currents.ltst_h, currents.sa771_current_a * 1000, s=3, label="East DBR string")
    ax.scatter(currents.ltst_h, currents.sa791_current_a * 1000, s=3, label="West DBR string")
    ax.set(
        xlabel="Local true solar time (Mars hours)",
        title=f"Measured currents: sol {sol}",
        xlim=(0, 24),
    )
    ax.grid(alpha=0.15)
axes[0].set_ylabel("DBR current (mA)")
axes[1].legend(fontsize=8)
plt.show()
Total running time of the script: (0 minutes 0.818 seconds)