Note
Go to the end to download the full example code.
Planning solar-array deployment evidence#
ESA’s October 26, 2026 CRISTAL testing update motivates a supplier’s evidence planning decision. ESA publishes no trial counts or deployment reliability. All trial rows below are synthetic, not CRISTAL results. Repeated cycles on one unit cannot be substituted for independent representative hardware trials.
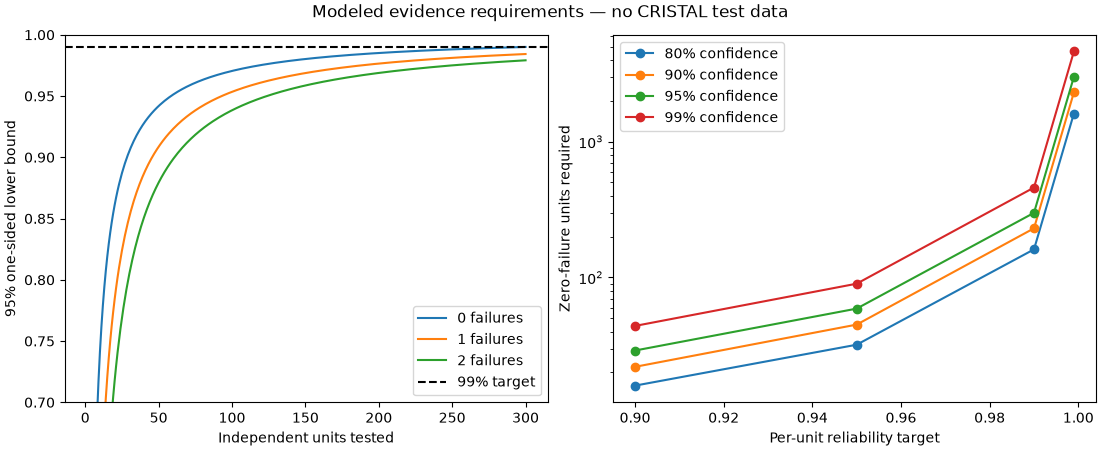
 reliability_target  confidence  zero_failure_units
              0.900        0.80                  16
              0.900        0.90                  22
              0.900        0.95                  29
              0.900        0.99                  44
              0.950        0.80                  32
              0.950        0.90                  45
              0.950        0.95                  59
              0.950        0.99                  90
              0.990        0.80                 161
              0.990        0.90                 230
              0.990        0.95                 299
              0.990        0.99                 459
              0.999        0.80                1609
              0.999        0.90                2302
              0.999        0.95                2995
              0.999        0.99                4603
         design_id    protocol_id  units  successes  failures  confidence  reliability_lower
illustrative_array        ambient     20         20         0        0.95           0.860892
illustrative_array thermal_vacuum     20         19         1        0.95           0.783894
from pathlib import Path

import matplotlib.pyplot as plt
import numpy as np
import pandas as pd

from orbitalpv.data import load_table
from orbitalpv.qualification import (
    deployment_reliability_lower_bound,
    summarize_deployment_trials,
    zero_failure_sample_size,
)


def study() -> tuple[pd.DataFrame, pd.DataFrame]:
    directory = Path(__file__).resolve().parent if "__file__" in globals() else Path.cwd()
    evidence = summarize_deployment_trials(load_table(directory / "_data/deployment_trials.csv"))
    plans = pd.DataFrame(
        [
            {
                "reliability_target": r,
                "confidence": c,
                "zero_failure_units": zero_failure_sample_size(r, confidence=c),
            }
            for r in (0.9, 0.95, 0.99, 0.999)
            for c in (0.8, 0.9, 0.95, 0.99)
        ]
    )
    return evidence, plans


def plot_study(evidence: pd.DataFrame, plans: pd.DataFrame) -> plt.Figure:
    fig, axes = plt.subplots(1, 2, figsize=(11, 4.5), layout="constrained")
    units = np.arange(1, 301)
    for failures in (0, 1, 2):
        axes[0].plot(
            units,
            [
                deployment_reliability_lower_bound(int(n) - failures, failures)
                if n >= failures
                else np.nan
                for n in units
            ],
            label=f"{failures} failures",
        )
    axes[0].axhline(0.99, color="black", linestyle="--", label="99% target")
    axes[0].set(
        xlabel="Independent units tested", ylabel="95% one-sided lower bound", ylim=(0.7, 1)
    )
    axes[0].legend()
    for confidence, group in plans.groupby("confidence"):
        axes[1].plot(
            group.reliability_target,
            group.zero_failure_units,
            "o-",
            label=f"{confidence:.0%} confidence",
        )
    axes[1].set(
        xlabel="Per-unit reliability target", ylabel="Zero-failure units required", yscale="log"
    )
    axes[1].legend()
    fig.suptitle("Modeled evidence requirements — no CRISTAL test data")
    print(evidence.to_string(index=False))
    return fig


if __name__ == "__main__":
    evidence, plans = study()
    print(plans.to_string(index=False))
    plot_study(evidence, plans)
    plt.show()
Total running time of the script: (0 minutes 0.353 seconds)