Note
Go to the end to download the full example code.
Telemetry-only daily health baseline#
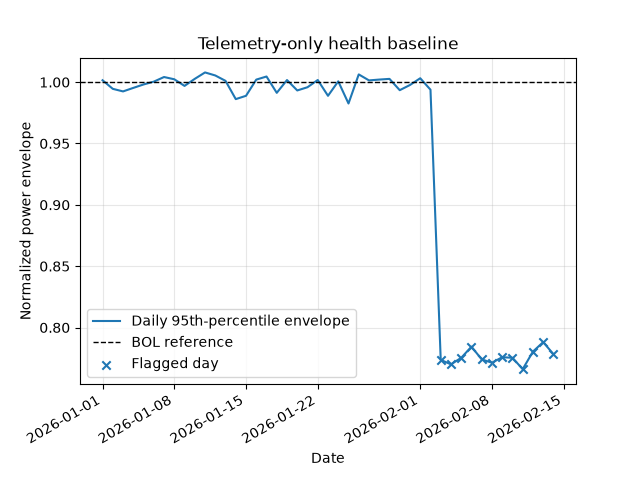
The Case 0 workflow demonstrates upper-envelope normalization and
persistent-loss detection through the public orbitalpv API.
import matplotlib.pyplot as plt

import orbitalpv as opv

telemetry = opv.make_demo_telemetry(seed=42)
normalized = opv.add_robust_baseline(opv.add_power(telemetry))
health = opv.daily_health(normalized)
anomalies = health[health["is_anomaly"]]

fig, ax = plt.subplots()
ax.plot(health["day"], health["power_envelope"], label="Daily 95th-percentile envelope")
ax.axhline(1.0, color="black", linestyle="--", linewidth=1, label="BOL reference")
ax.scatter(
    anomalies["day"],
    anomalies["power_envelope"],
    marker="x",
    label="Flagged day",
)
ax.set(ylabel="Normalized power envelope", xlabel="Date")
ax.set_title("Telemetry-only health baseline")
ax.legend()
ax.grid(True, alpha=0.3)
fig.autofmt_xdate()
plt.show()
Total running time of the script: (0 minutes 0.127 seconds)