Note
Go to the end to download the full example code.
Rover routing with terrain, sunlight and battery reserve#
Find the earliest feasible arrival on a small measured-terrain grid. Costs include rolling resistance, ascent, housekeeping, heating and battery losses. Solar power uses computed terrain shadows and an illustrative tracking array. The four-neighbour planner can wait to charge. Slopes below grid resolution, wheel slip, obstacles smaller than a cell and actual rover calibration are absent. The 12-hour July window is selected for the largest spatial solar-power spread, so it illustrates mixed lighting rather than average mission conditions.
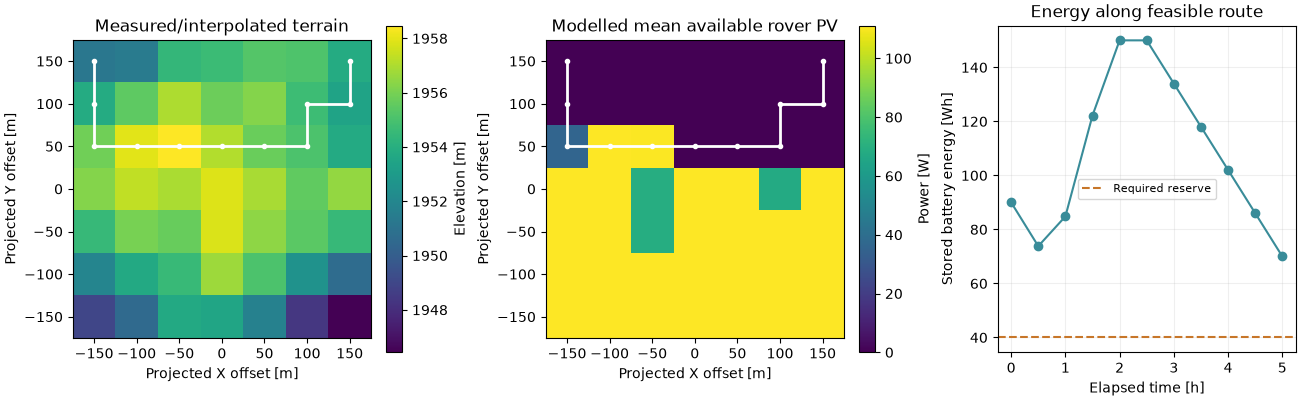
 time_s  row  column  energy_wh  elevation_m
    0.0    6       0  90.000000  1951.206543
 1800.0    5       0  73.807823  1953.804077
 3600.0    4       0  84.814526  1955.867065
 5400.0    4       1 122.179819  1957.915405
 7200.0    4       2 150.000000  1958.475952
 9000.0    4       3 150.000000  1957.099365
10800.0    4       4 134.013081  1955.707764
12600.0    4       5 118.026224  1955.082275
14400.0    5       5 102.039376  1954.709839
16200.0    5       6  86.052467  1953.402344
18000.0    6       6  70.034953  1953.790771
import matplotlib.pyplot as plt
import numpy as np
from _lunar_analysis import analysis

from orbitalpv import lunar

terrain, time, solar, rover = analysis.rover_inputs()
path = lunar.energy_aware_route(
    terrain.elevation_m,
    time,
    solar,
    cell_size_m=50,
    start=(6, 0),
    goal=(6, 6),
    rover=rover,
    heater_power_w=10,
)
x, y, _ = analysis.point("01")
fig, axes = plt.subplots(1, 3, figsize=(13, 4), layout="constrained")
for ax, values, title, units in [
    (axes[0], terrain.elevation_m, "Measured/interpolated terrain", "Elevation [m]"),
    (axes[1], np.mean(solar, axis=0), "Modelled mean available rover PV", "Power [W]"),
]:
    im = ax.pcolormesh(terrain.x_m - x, terrain.y_m - y, values, shading="auto", cmap="viridis")
    ax.plot(
        terrain.x_m[path.column.to_numpy(int)] - x,
        terrain.y_m[path.row.to_numpy(int)] - y,
        "w.-",
        lw=2,
    )
    fig.colorbar(im, ax=ax, label=units)
    ax.set(
        xlabel="Projected X offset [m]",
        ylabel="Projected Y offset [m]",
        title=title,
        aspect="equal",
    )
axes[2].plot(path.time_s / 3600, path.energy_wh, "o-", color="#398c99")
axes[2].axhline(rover.reserve_wh, color="#c77629", ls="--", label="Required reserve")
axes[2].set(
    xlabel="Elapsed time [h]",
    ylabel="Stored battery energy [Wh]",
    title="Energy along feasible route",
)
axes[2].legend(fontsize=8)
axes[2].grid(alpha=0.2)
print(path.to_string(index=False))
plt.show()
Total running time of the script: (0 minutes 9.724 seconds)