Note
Go to the end to download the full example code.
Construction history as observation brackets#
This is a SYNTHETIC geometry scenario. The bundled real image cache contains only one observation per site, so it cannot establish construction dates. The overlap graph groups a split into two polygons, detects footprint growth, and reports newly observed/disappeared objects without inventing commissioning.
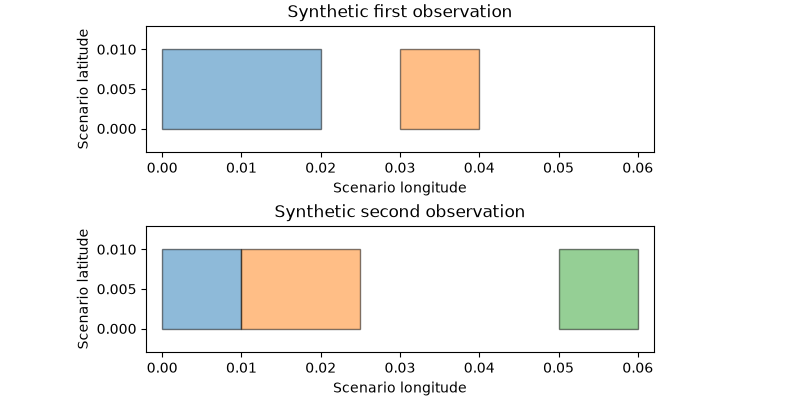
{'before_ids': ['0'], 'after_ids': ['0', '1'], 'status': 'expanded_footprint', 'split_or_merge': True, 'change_window_start_exclusive': None}
{'before_ids': ['1'], 'after_ids': [], 'status': 'not_redetected', 'split_or_merge': False, 'change_window_start_exclusive': None}
{'before_ids': [], 'after_ids': ['2'], 'status': 'newly_observed', 'split_or_merge': False, 'change_window_start_exclusive': None}
observed footprint change bracket; not electrical commissioning
import matplotlib.pyplot as plt

from orbitalpv.ground_research import match_pv_changes


def synthetic_collection(boxes):
    return {
        "type": "FeatureCollection",
        "metadata": {"source": "synthetic scenario", "license": "CC0"},
        "features": [
            {
                "type": "Feature",
                "id": str(i),
                "properties": {"synthetic": True},
                "geometry": {
                    "type": "Polygon",
                    "coordinates": [[[w, s], [e, s], [e, n], [w, n], [w, s]]],
                },
            }
            for i, (w, s, e, n) in enumerate(boxes)
        ],
    }


before = synthetic_collection([(0, 0, 0.02, 0.01), (0.03, 0, 0.04, 0.01)])
after = synthetic_collection([(0, 0, 0.01, 0.01), (0.01, 0, 0.025, 0.01), (0.05, 0, 0.06, 0.01)])
report = match_pv_changes(before, after, before_time="2024-01-01", after_time="2025-01-01")
fig, axes = plt.subplots(2, 1, figsize=(8, 4), constrained_layout=True)
for ax, collection, title in zip(
    axes,
    (before, after),
    ("Synthetic first observation", "Synthetic second observation"),
    strict=True,
):
    for feature in collection["features"]:
        coordinates = feature["geometry"]["coordinates"][0]
        ax.fill(
            [p[0] for p in coordinates], [p[1] for p in coordinates], alpha=0.5, edgecolor="black"
        )
    ax.set(
        xlim=(-0.002, 0.062),
        ylim=(-0.003, 0.013),
        title=title,
        xlabel="Scenario longitude",
        ylabel="Scenario latitude",
    )
    ax.set_aspect("equal")
for change in report["changes"]:
    print(
        {
            key: change[key]
            for key in (
                "before_ids",
                "after_ids",
                "status",
                "split_or_merge",
                "change_window_start_exclusive",
            )
        }
    )
print(report["date_semantics"])
plt.show()
Total running time of the script: (0 minutes 0.154 seconds)