Note
Go to the end to download the full example code.
Diviner ground temperatures and a vacuum panel thermal model#
Diviner provides measured, spatially binned bolometric brightness temperatures, not PV cell temperatures. Use nearby 10th/50th/90th percentiles as three constant ground-temperature scenarios, then solve panel heating/cooling under July 2026 modelled sunlight. The observation bins span 2009–2020, L_s 0–60 degrees and subsolar longitude 0–15 degrees; they are not July 2026 measurements.
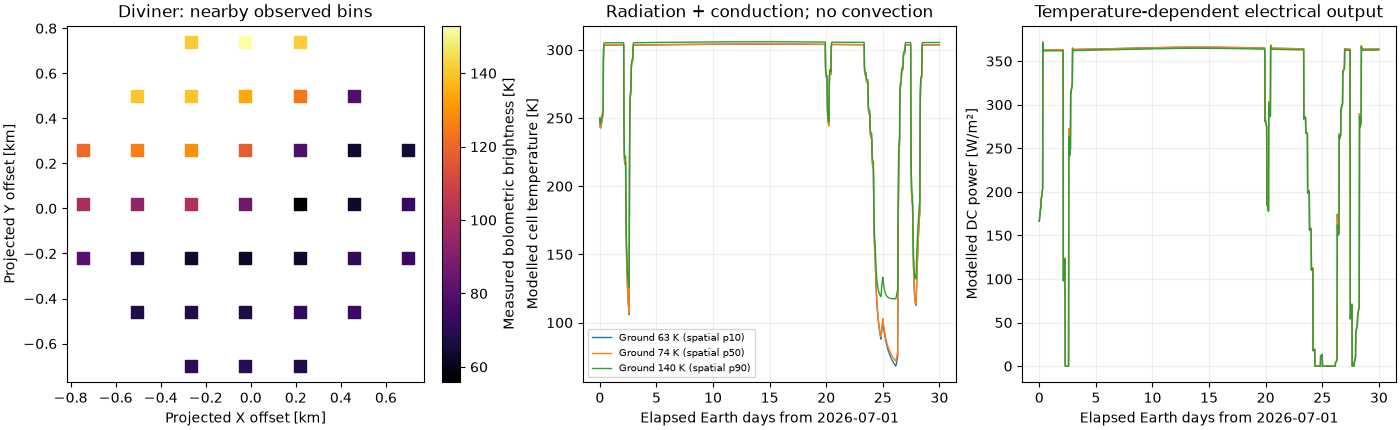
Maximum thermal energy-balance residual [J]: 5.122274160385132e-09
import matplotlib.pyplot as plt
import pandas as pd
from _lunar_analysis import analysis

from orbitalpv import lunar, physics

observed = analysis.temperature_observations()
observed = observed[(observed.site == "01") & (observed.distance_from_site_m < 800)]
profile = analysis.profile("01", 5, "sun_tracking", "month")
cases = []
for quantile in (0.1, 0.5, 0.9):
    result = lunar.lunar_panel_thermal(
        profile.time_s,
        profile.poa_direct_w_m2,
        ground_temperature_k=float(observed.temperature_k.quantile(quantile)),
        ground_view_factor=0.5,
        ground_emissivity=1.0,
        surface=physics.ThermalSurface(heat_capacity_j_k=10000),
        pv_efficiency=0.28,
        initial_temperature_k=250,
        max_step_s=300,
    )
    result["ground_scenario_quantile"] = quantile
    cases.append(result)
thermal = pd.concat(cases, ignore_index=True)
fig, axes = plt.subplots(1, 3, figsize=(14, 4.3), layout="constrained")
x, y, _ = analysis.point("01")
im = axes[0].scatter(
    (observed.x_m - x) / 1000,
    (observed.y_m - y) / 1000,
    c=observed.temperature_k,
    cmap="inferno",
    s=75,
    marker="s",
)
fig.colorbar(im, ax=axes[0], label="Measured bolometric brightness [K]")
axes[0].set(
    title="Diviner: nearby observed bins",
    xlabel="Projected X offset [km]",
    ylabel="Projected Y offset [km]",
    aspect="equal",
)
for _, values in thermal.groupby("ground_scenario_quantile"):
    quantile = float(values.ground_scenario_quantile.iloc[0])
    label = f"Ground {values.ground_temperature_k.iloc[0]:.0f} K (spatial p{int(quantile * 100)})"
    axes[1].plot(values.time_s / 86400, values.temperature_k, label=label, lw=1)
    axes[2].plot(values.time_s / 86400, values.pv_power_w, label=label, lw=1)
axes[1].set(ylabel="Modelled cell temperature [K]", title="Radiation + conduction; no convection")
axes[2].set(ylabel="Modelled DC power [W/m²]", title="Temperature-dependent electrical output")
for ax in axes[1:]:
    ax.set_xlabel("Elapsed Earth days from 2026-07-01")
    ax.grid(alpha=0.2)
axes[1].legend(fontsize=7)
print("Maximum thermal energy-balance residual [J]:", thermal.energy_balance_error_j.abs().max())
plt.show()
Total running time of the script: (0 minutes 1.215 seconds)