Note
Go to the end to download the full example code.
Satellite PV evidence coverage#
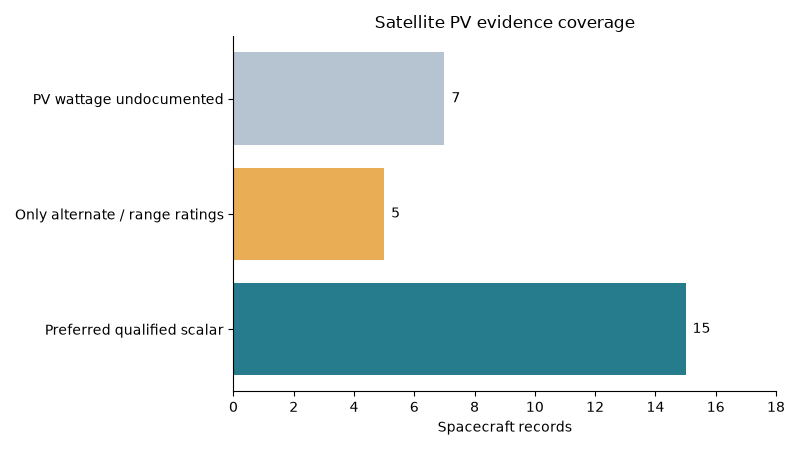
Compare documented wattage evidence with gaps without adding incompatible ratings. All records are loaded offline from the installed package. Historical designs, ranges and conflicting source assertions count as documented, not validated telemetry.
                               name  pv_power_w       power_basis                                                                      power_conditions
                            GSAT-30         NaN               NaN                                                                                   NaN
                               Juno       500.0 mission_reference                                     Manufacturer approximate design output at Jupiter
                        Sentinel-2A      2300.0               BOL         Shared A/B platform design, start of mission; not individual flight telemetry
                               DART      6600.0               BOL                        2018 supplier design rating for the complete DART array system
                        Sentinel-2B      2300.0               BOL         Shared A/B platform design, start of mission; not individual flight telemetry
                              GOSAT         NaN               NaN                                                                                   NaN
                             Psyche     21000.0 mission_reference                                                      Leaving Earth; design capability
                            GSAT-11         NaN               NaN                                                                                   NaN
                    Rosetta orbiter       850.0 mission_reference                                                     Published design output at 3.4 AU
                               Dawn     10000.0 mission_reference                                                             Earth-distance capability
                               TESS         NaN               NaN                                                                                   NaN
         James Webb Space Telescope      2000.0 mission_reference Mission-lifetime supply statement; temperature and explicit BOL/EOL value unspecified
                               Lucy       504.0 mission_reference                                                   Farthest encounter design condition
                              MAVEN         NaN               NaN                                                                                   NaN
                       Deep Space 1      2500.0 mission_reference                                                        At Earth heliocentric distance
                       Mars Express       500.0 mission_reference                                 Mars at aphelion; life basis and exact AU unspecified
                     Europa Clipper       700.0 mission_reference                                                 Array design requirement near Jupiter
                         Cartosat-1      1100.0       unspecified                      Published solar-array generation; life/temperature not specified
                           AstroSat         NaN               NaN                                                                                   NaN
                             ALOS-2         NaN               NaN                                                                                   NaN
                             EOS-04         NaN               NaN                                                                                   NaN
             Hubble Space Telescope         NaN               NaN                                                                                   NaN
                             Kepler      1100.0 mission_reference                                                   Preflight expected array generation
BepiColombo Mercury Transfer Module         NaN               NaN                                                                                   NaN
                      Solar Orbiter         NaN               NaN                                                                                   NaN
                         SPACE HAUC         NaN               NaN                                                                                   NaN
                              JUICE       850.0 mission_reference     Design output for distant Jupiter operations; exact AU and life basis unspecified
import matplotlib.pyplot as plt
import pandas as pd

from orbitalpv import catalogue

rows = catalogue.load_records("satellites")
frame = pd.DataFrame(rows)
print(
    frame.reindex(columns=["name", "pv_power_w", "power_basis", "power_conditions"]).to_string(
        index=False
    )
)

known = sum(row.get("pv_power_w") is not None for row in rows)
alternate = sum(
    row.get("pv_power_w") is None and bool(row.get("power_ratings_json")) for row in rows
)
missing = len(rows) - known - alternate
fig, ax = plt.subplots(figsize=(8, 4.5))
labels = ["Preferred qualified scalar", "Only alternate / range ratings", "PV wattage undocumented"]
counts = [known, alternate, missing]
bars = ax.barh(labels, counts, color=["#267c8c", "#e8ad55", "#b6c3d1"])
ax.bar_label(bars, padding=5)
ax.set(
    xlabel="Spacecraft records", title="Satellite PV evidence coverage", xlim=(0, max(counts) + 3)
)
ax.spines[["top", "right"]].set_visible(False)
fig.tight_layout()
plt.show()
Total running time of the script: (0 minutes 0.088 seconds)