Note
Go to the end to download the full example code.
Compare five space solar-cell technologies#
Compare representative AM0 I-V and P-V curves for five important space-PV technology families using only the public orbitalpv API.
The reference points are technology-level baselines rather than exact manufacturer-part models. For mission work, replace the built-in technology template with calibrated cell data.
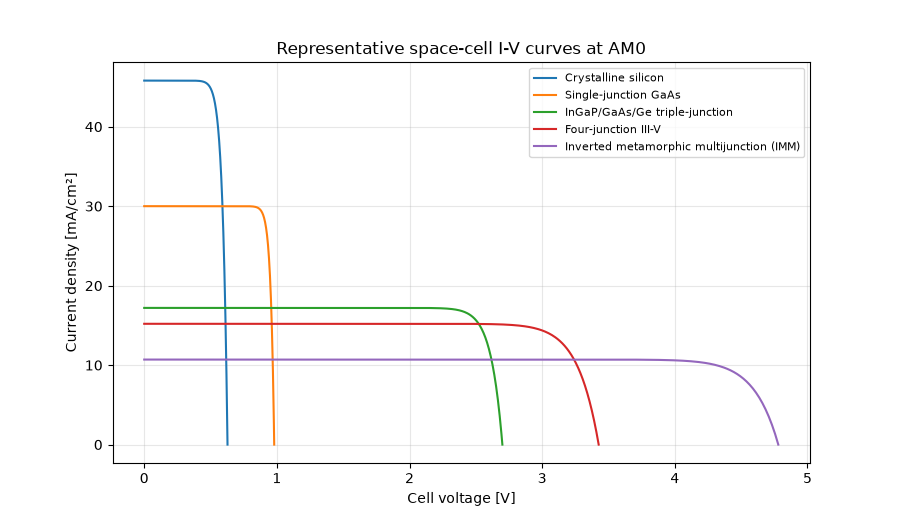
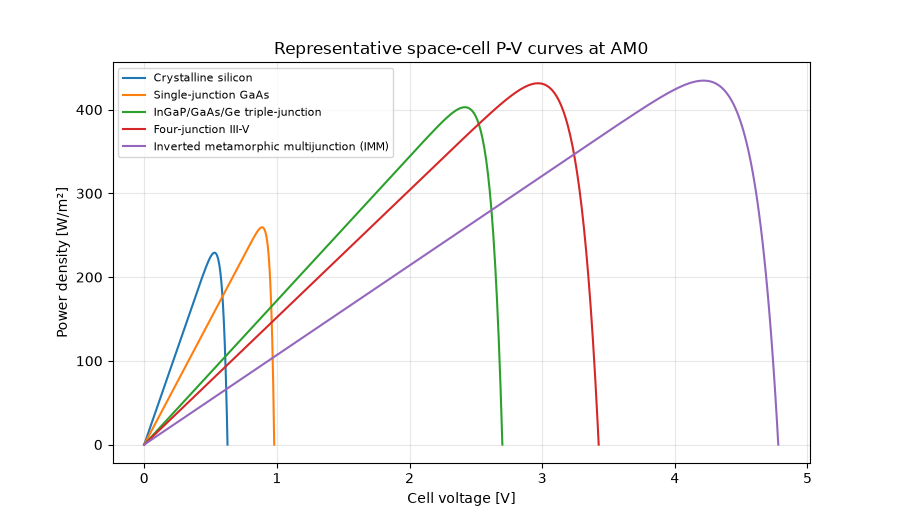
AM0 reference comparison
Crystalline silicon                        eta= 16.8% Voc= 0.63 V Pmp= 229.2 W/m2
Single-junction GaAs                       eta= 19.1% Voc= 0.98 V Pmp= 259.5 W/m2
InGaP/GaAs/Ge triple-junction              eta= 29.6% Voc= 2.70 V Pmp= 402.9 W/m2
Four-junction III-V                        eta= 31.7% Voc= 3.43 V Pmp= 431.5 W/m2
Inverted metamorphic multijunction (IMM)   eta= 31.9% Voc= 4.78 V Pmp= 434.7 W/m2
from __future__ import annotations

import matplotlib.pyplot as plt

import orbitalpv as opv

technologies = opv.list_space_cell_technologies()
simulations = [opv.simulate_space_cell(technology) for technology in technologies]

print("AM0 reference comparison")
for result in simulations:
    print(
        f"{result.technology.name:42s} "
        f"eta={100.0 * result.efficiency:5.1f}% "
        f"Voc={result.voc_v:5.2f} V "
        f"Pmp={result.pmp_w_m2:6.1f} W/m2"
    )

fig, ax = plt.subplots(figsize=(9, 5.2))
for result in simulations:
    ax.plot(
        result.voltage_v,
        result.current_density_ma_cm2,
        label=result.technology.name,
    )
ax.set(xlabel="Cell voltage [V]", ylabel="Current density [mA/cm²]")
ax.set_title("Representative space-cell I-V curves at AM0")
ax.grid(True, alpha=0.3)
ax.legend(fontsize=8)
plt.show()

fig, ax = plt.subplots(figsize=(9, 5.2))
for result in simulations:
    ax.plot(
        result.voltage_v,
        result.power_density_w_m2,
        label=result.technology.name,
    )
ax.set(xlabel="Cell voltage [V]", ylabel="Power density [W/m²]")
ax.set_title("Representative space-cell P-V curves at AM0")
ax.grid(True, alpha=0.3)
ax.legend(fontsize=8)
plt.show()
Total running time of the script: (0 minutes 0.180 seconds)