Note
Go to the end to download the full example code.
Canary Islands: AEMET-adjusted ERA5 degradation-rate rasters#
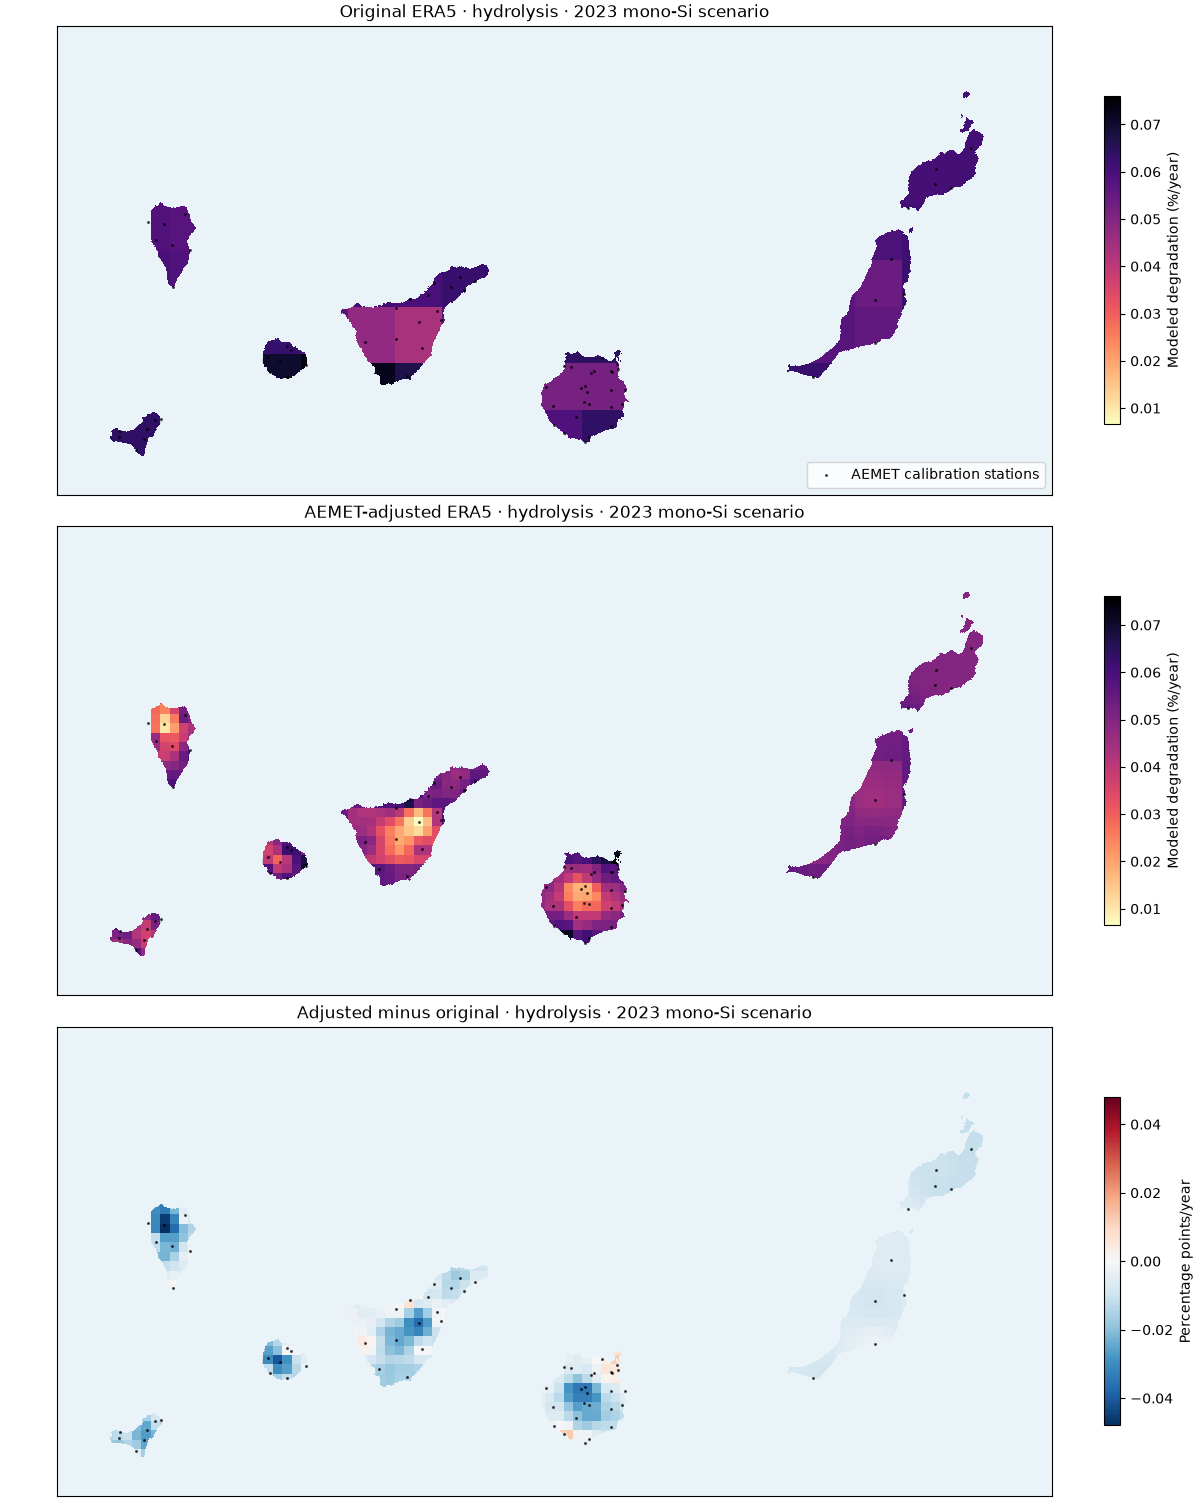
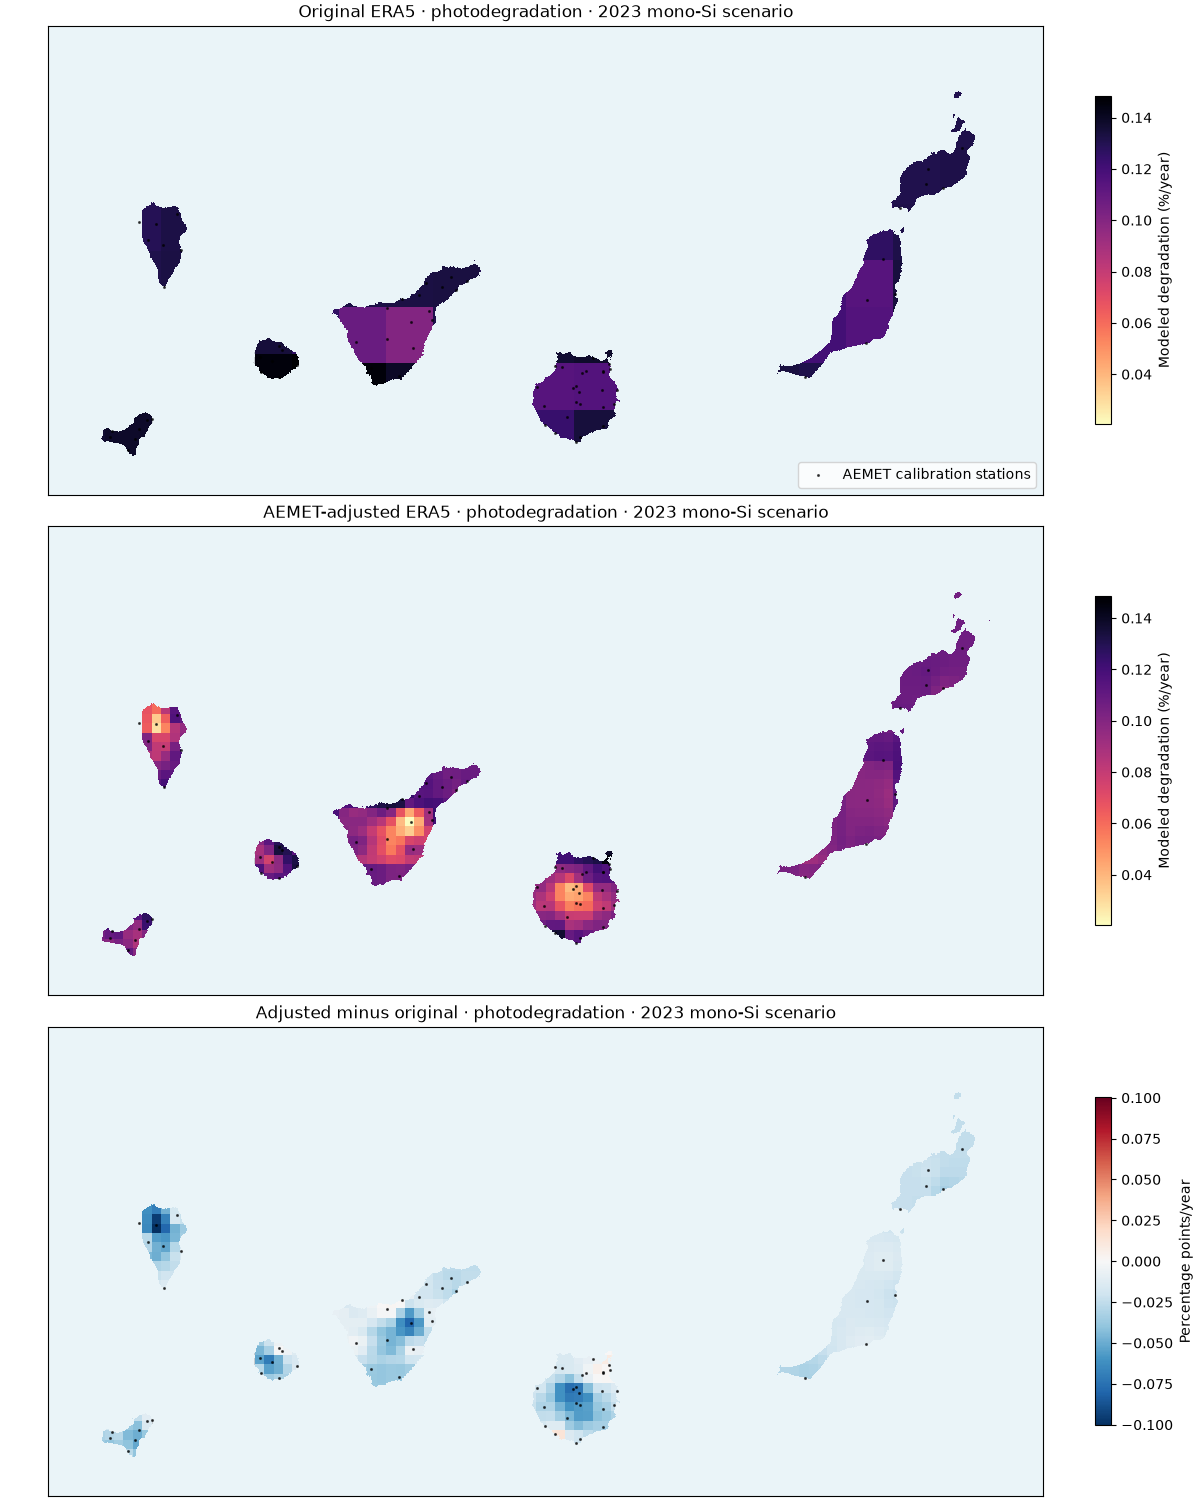
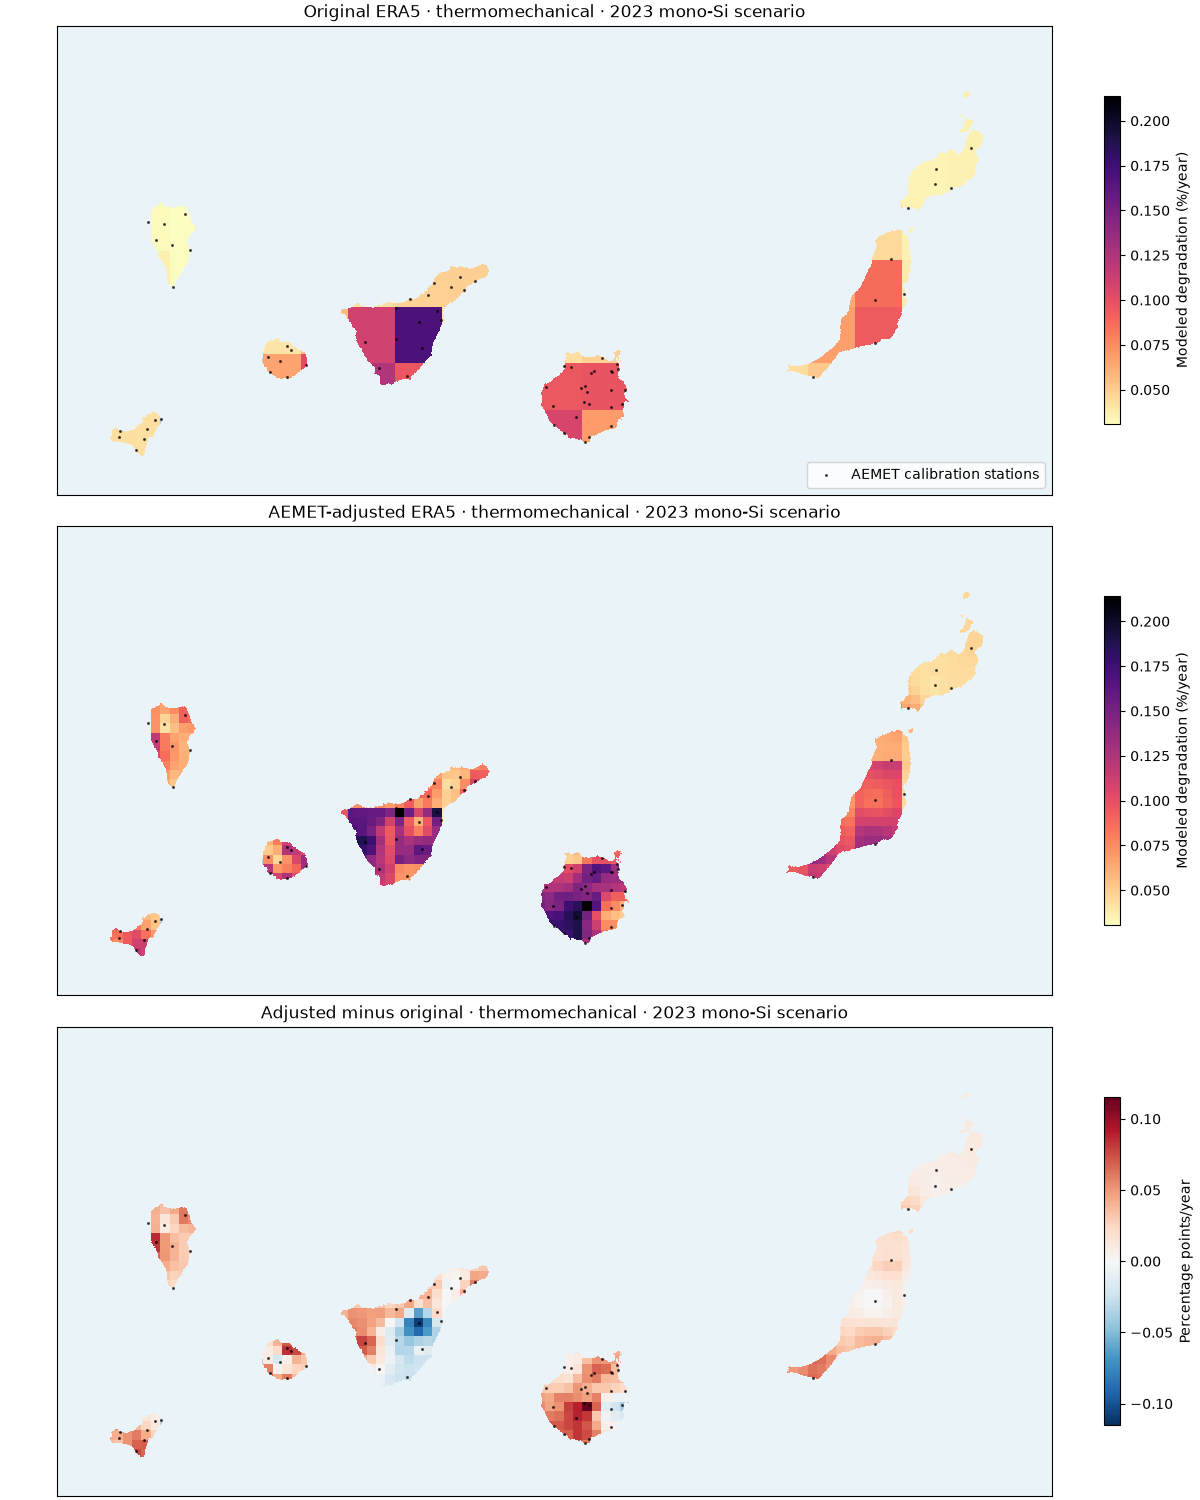
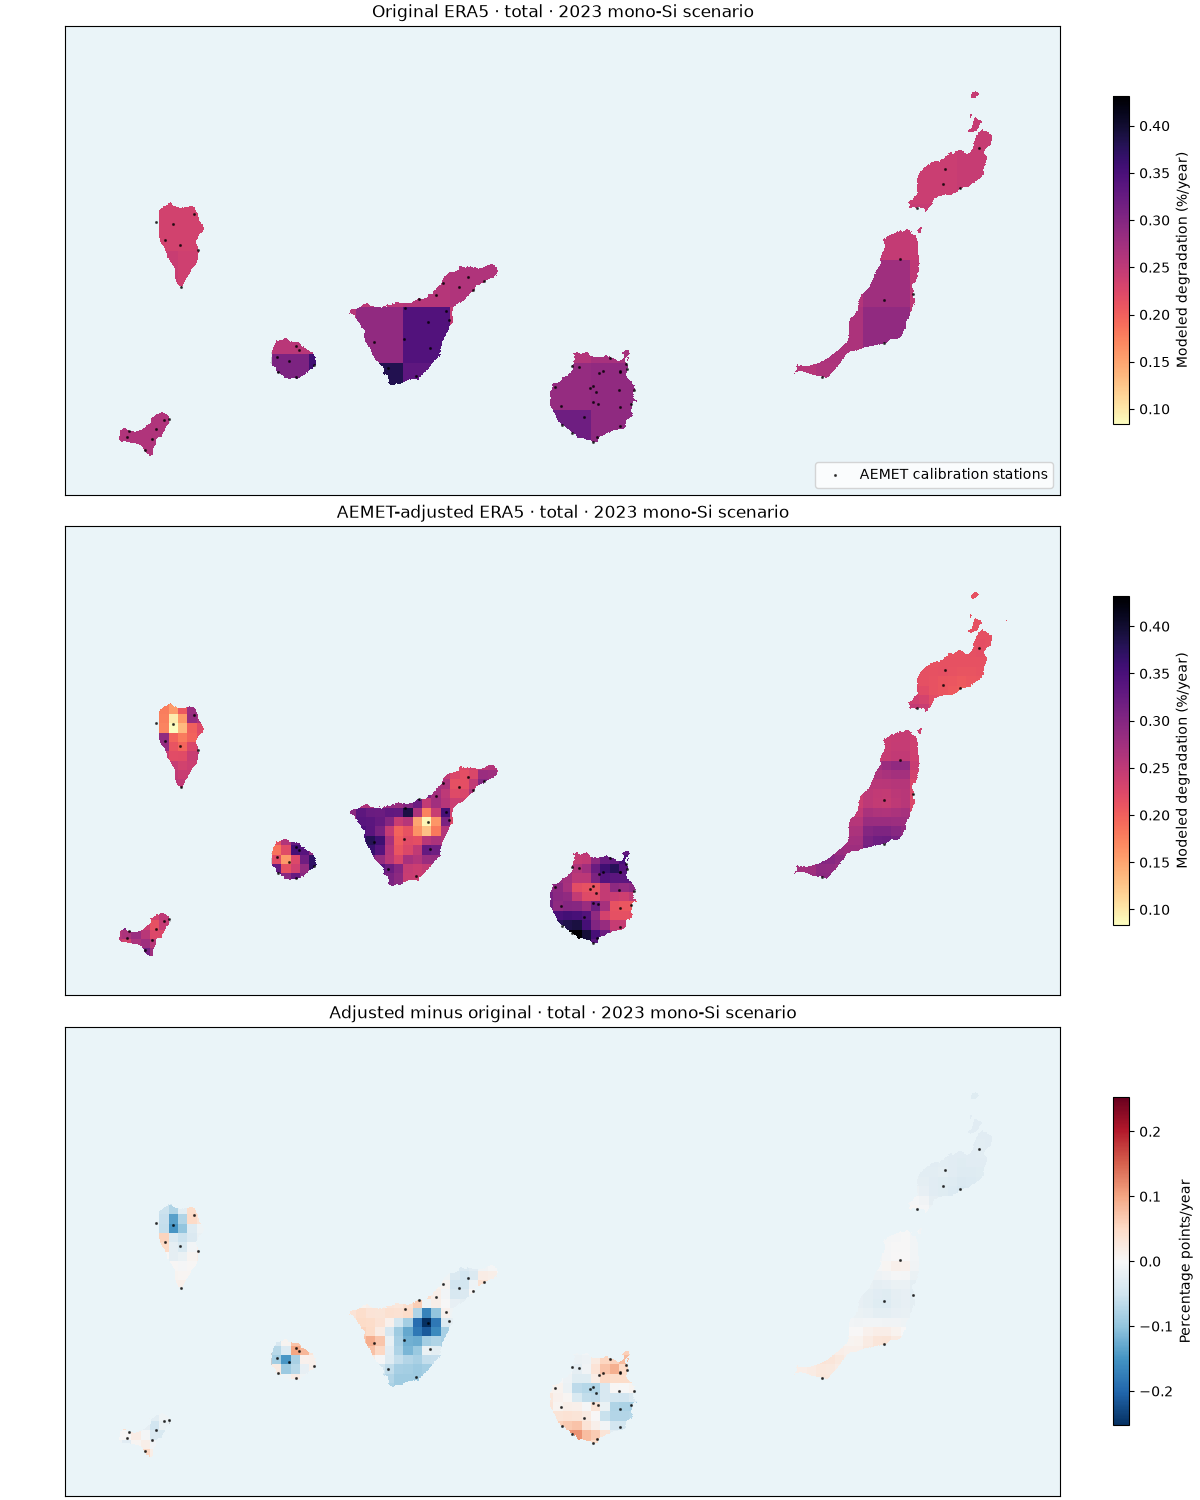
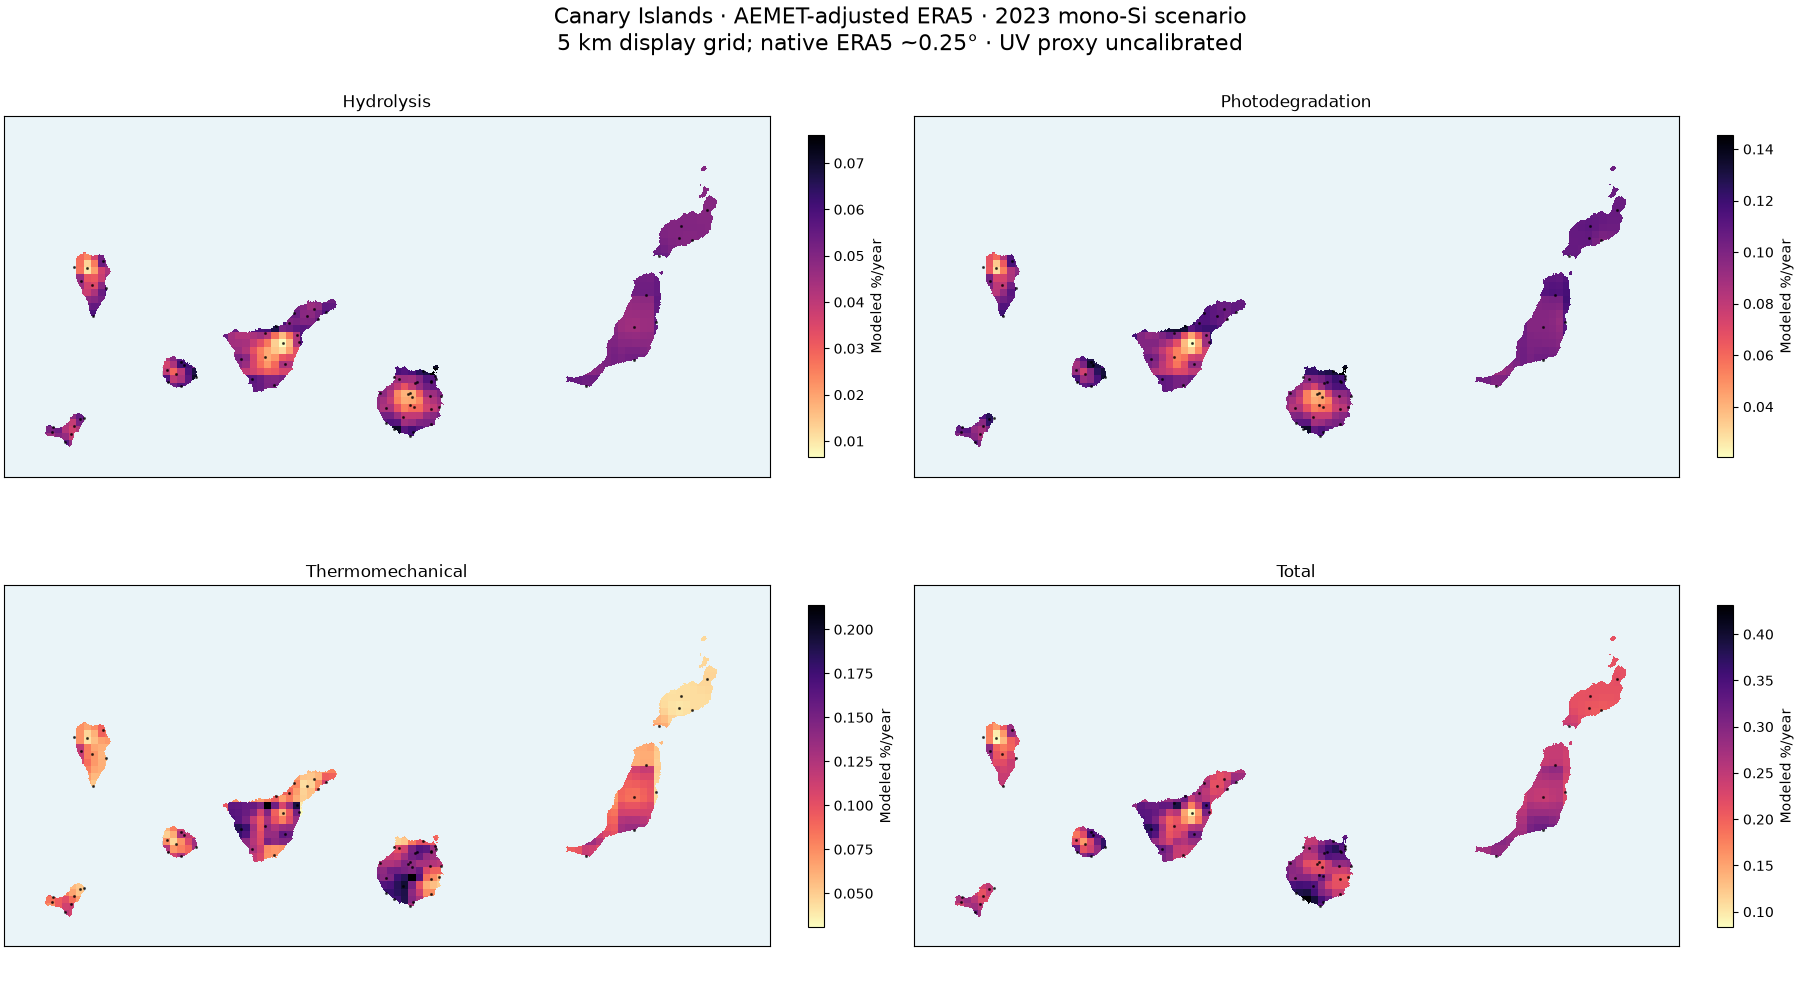
Continuous land surfaces replace isolated colored points. Monthly temperature, relative-humidity and wind biases are fitted with AEMET observations in 2022; 2023 is held out for temporal and leave-station-out evaluation. Nearest four station corrections within 75 km are transferred to a 5 km display grid. Native ERA5 weather remains approximately 0.25 degrees; no 5 km accuracy or terrain downscaling is implied. AEMET station markers are validation overlays.
Rates are a published mono-Si material scenario in %/year, not measured loss. Hydrolysis, photodegradation and thermomechanical mechanisms use the existing Kaaya calibration. AEMET calibrates the weather, not the material parameters. ERA5 radiation is uncorrected; UV is explicitly estimated as 5% of GHI. The 4-6% sensitivity range is not a confidence interval. Other mechanisms, including PID and LeTID, are not identified by these meteorological observations.
This offline gallery recomputes rates from saved annual stress drivers. Full
hourly acquisition, bias fitting, validation and raster export are reproduced
with scripts/prepare_aemet_canary_calibration.py and
scripts/analyze_aemet_canary_calibration.py. See the
study guide for coverage and limits.
Download the reproducible results:
Spatial holdout temperature RMSE increases slightly (2.60 to 2.66 °C), despite improved station-level temporal validation. RH and wind spatial RMSE improve. The maps therefore remain provisional scenarios, not demonstrated temperature accuracy between stations or measured PV field losses.
import json
from pathlib import Path

import matplotlib.pyplot as plt
import numpy as np
import pandas as pd
import rasterio
from matplotlib.colors import ListedColormap, Normalize, TwoSlopeNorm
from rasterio.plot import plotting_extent
from rasterio.transform import from_origin
from rasterio.warp import Resampling, reproject, transform

from energy_methods.degradation import DegradationParameters, degradation_rates
Recompute all mechanisms from the captured annual stresses#
folder = Path("aemet_era5_canary")
results = pd.read_csv(folder / "rates.csv")
summary = json.loads((folder / "summary.json").read_text())
parameters = DegradationParameters(**summary["degradation_parameters"])
names = ["hydrolysis", "photodegradation", "thermomechanical", "total"]
for prefix in ("raw", "corrected"):
    drivers = {
        c.removeprefix(f"{prefix}_driver_"): results[c].to_numpy(float)
        for c in results
        if c.startswith(f"{prefix}_driver_")
    }
    rates = degradation_rates(**drivers, parameters=parameters)
    for name in names:
        np.testing.assert_allclose(
            results[f"{prefix}_{name}"], getattr(rates, name), rtol=1e-8, equal_nan=True
        )
print("Modeled rates (%/year):", summary["ranges_percent_per_year"])
print(
    "Calibration support:",
    summary["supported_grid_cells"],
    "/",
    summary["grid_cells"],
    "land display cells",
)
Modeled rates (%/year): {'hydrolysis': [0.006563625658896963, 0.07604629956309433], 'photodegradation': [0.020480374809661472, 0.14543782265145713], 'thermomechanical': [0.030943855748256605, 0.21387780583624164], 'total': [0.08367369594353756, 0.43160400999580284]}
Calibration support: 441 / 441 land display cells
Raster surfaces clipped to island land masks#
Coastline pixels only clip the image: they do not add climate information.
land = []
for path in sorted(Path(".").glob("pvdeg_canary_*.tif")):
    with rasterio.open(path) as src:
        land.append((src.read_masks(1) > 0, src.transform, src.crs))
stations = pd.read_csv(folder / "stations.csv")
coefficients = pd.read_csv(folder / "calibration_parameters.csv")
used = stations.loc[stations.station_id.isin(coefficients.station_id)]
sx, sy = transform("EPSG:4326", "EPSG:32628", used.longitude.to_numpy(), used.latitude.to_numpy())
affine = from_origin(160000, 3290000, 5000, 5000)


def draw_surface(ax, column, norm, cmap):
    array = np.full((50, 106), np.nan, dtype="float32")
    array[results.row.to_numpy(int), results.col.to_numpy(int)] = results[column].to_numpy(float)
    for mask, geo, crs in land:
        ax.imshow(
            np.ma.masked_where(~mask, np.ones(mask.shape)),
            extent=plotting_extent(mask, geo),
            cmap=ListedColormap(["#c5cbd0"]),
            interpolation="nearest",
        )
        dest = np.full(mask.shape, np.nan, dtype="float32")
        reproject(
            array,
            dest,
            src_transform=affine,
            src_crs="EPSG:32628",
            src_nodata=np.nan,
            dst_transform=geo,
            dst_crs=crs,
            dst_nodata=np.nan,
            resampling=Resampling.nearest,
        )
        dest[~mask] = np.nan
        ax.imshow(
            np.ma.masked_invalid(dest),
            extent=plotting_extent(dest, geo),
            norm=norm,
            cmap=cmap,
            interpolation="nearest",
        )
    ax.scatter(
        sx, sy, marker=".", s=6, color="black", alpha=0.6, label="AEMET calibration stations"
    )
    ax.set(xlim=(160000, 690000), ylim=(3040000, 3290000))
    ax.set_facecolor("#eaf4f8")
    ax.set_xticks([])
    ax.set_yticks([])


for name in names:
    values = results[[f"raw_{name}", f"corrected_{name}"]].to_numpy(float)
    norm = Normalize(vmin=float(np.nanmin(values)), vmax=float(np.nanmax(values)))
    delta = float(np.nanmax(np.abs(results[f"delta_{name}"]))) or 1e-6
    fig, axes = plt.subplots(3, 1, figsize=(12, 15), layout="constrained")
    for ax, prefix, title in zip(
        axes,
        ("raw", "corrected", "delta"),
        ("Original ERA5", "AEMET-adjusted ERA5", "Adjusted minus original"),
        strict=True,
    ):
        current_norm = (
            TwoSlopeNorm(vmin=-delta, vcenter=0, vmax=delta) if prefix == "delta" else norm
        )
        cmap = "RdBu_r" if prefix == "delta" else "magma_r"
        draw_surface(ax, f"{prefix}_{name}", current_norm, cmap)
        ax.set_title(f"{title} · {name} · 2023 mono-Si scenario")
        fig.colorbar(
            plt.cm.ScalarMappable(norm=current_norm, cmap=cmap),
            ax=ax,
            label="Percentage points/year" if prefix == "delta" else "Modeled degradation (%/year)",
            shrink=0.7,
        )
    axes[0].legend(loc="lower right")
    fig.savefig(folder / f"{name}_comparison.png", dpi=160)
Four calibrated mechanism surfaces together#
fig, axes = plt.subplots(2, 2, figsize=(18, 10), layout="constrained")
for ax, name in zip(axes.flat, names, strict=True):
    values = results[f"corrected_{name}"]
    norm = Normalize(vmin=float(values.min()), vmax=float(values.max()))
    draw_surface(ax, f"corrected_{name}", norm, "magma_r")
    ax.set_title(name.replace("thermomechanical", "Thermomechanical").capitalize())
    fig.colorbar(
        plt.cm.ScalarMappable(norm=norm, cmap="magma_r"), ax=ax, label="Modeled %/year", shrink=0.7
    )
fig.suptitle(
    "Canary Islands · AEMET-adjusted ERA5 · 2023 mono-Si scenario\n"
    "5 km display grid; native ERA5 ~0.25° · UV proxy uncalibrated",
    fontsize=16,
)
fig.savefig(folder / "calibrated_degradation_maps.png", dpi=160)
Honest validation: held-out year and held-out station#
An increase in RMSE means this correction worsens that validation target.
validation = pd.read_csv(folder / "validation.csv")
fig, axes = plt.subplots(1, 3, figsize=(15, 5), layout="constrained")
for ax, variable in zip(
    axes, ("temperature_c", "relative_humidity_percent", "wind_speed_ms"), strict=True
):
    data = validation.loc[
        (validation.variable == variable)
        & (validation.validation == "spatial_and_temporal_holdout")
    ]
    ax.scatter(data.raw_monthly_rmse, data.corrected_monthly_rmse, alpha=0.7)
    limit = max(data.raw_monthly_rmse.max(), data.corrected_monthly_rmse.max()) * 1.05
    ax.plot([0, limit], [0, limit], "k--", linewidth=1)
    ax.set(xlabel="Raw monthly RMSE", ylabel="Corrected monthly RMSE", title=variable)
    ax.set_xlim(0, limit)
    ax.set_ylim(0, limit)
print(
    validation.groupby(["validation", "variable"])[
        ["raw_monthly_rmse", "corrected_monthly_rmse"]
    ].mean()
)
fig.savefig(folder / "validation.png", dpi=160)
plt.show()
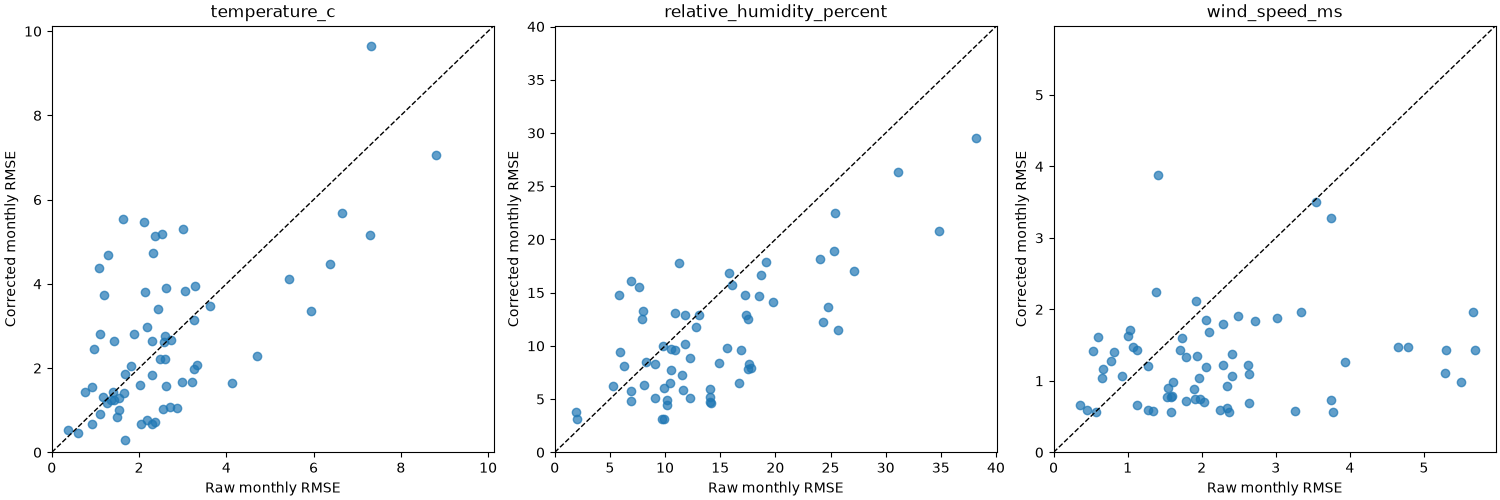
                                                        raw_monthly_rmse  corrected_monthly_rmse
validation                   variable
spatial_and_temporal_holdout relative_humidity_percent         14.266418               10.879198
                             temperature_c                      2.601537                2.660930
                             wind_speed_ms                      2.231436                1.278837
temporal_holdout             relative_humidity_percent         13.897697                7.870307
                             temperature_c                      2.607916                0.952287
                             wind_speed_ms                      2.197268                0.661140
Total running time of the script: (0 minutes 12.573 seconds)