Note
Go to the end to download the full example code.
Eskom: reported hourly renewable generation in South Africa#
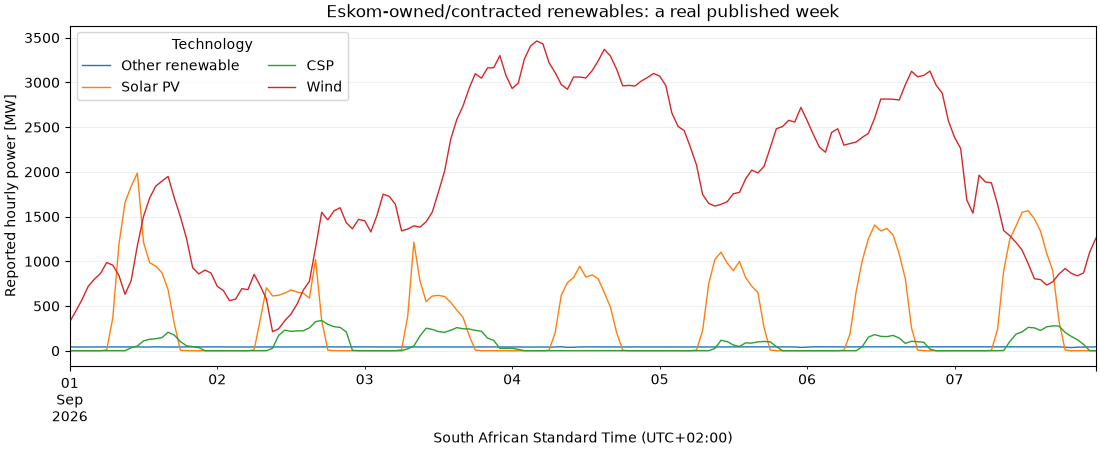
Read real wind, PV, CSP and other-renewable observations from Eskom’s hourly renewable export. The scope is Eskom-owned/contracted renewables and excludes embedded generation. The figure must therefore not be interpreted as all South African renewable output.
The default example uses the captured native CSV
and source manifest. Download the
complete generation examples for local use.
Set ENERGY_DATA_INSIGHTS_LIVE=1 to discover and retrieve the latest official file.
1. Read a verifiable capture, or discover the current monthly upload#
Eskom’s chart page can retain an outdated upload URL. The connector queries
the public media catalogue for the exact Hourly_Generation.csv family,
excluding the separate Total_Hourly_Generation.csv product.
import hashlib
import json
import os
from pathlib import Path

import matplotlib.pyplot as plt
import pandas as pd

from energy_data_retrieval.sources.eskom import ESKOM_HOSTS, EskomClient, parse_generation_csv
from energy_data_retrieval.transport import HTTPClient

example_dir = (
    Path(globals().get("__file__", Path.cwd() / "plot_generation_eskom.py")).resolve().parent
)
data_dir = example_dir / "data"
if os.environ.get("ENERGY_DATA_INSIGHTS_LIVE") == "1":
    with HTTPClient(ESKOM_HOSTS) as http:
        result = EskomClient(http).generation()
    frame = result.frame
    print("Retrieved public requests:", len(result.requests))
else:
    content = (data_dir / "generation_eskom.csv").read_bytes()
    manifest = json.loads((data_dir / "generation_eskom_provenance.json").read_text())
    if hashlib.sha256(content).hexdigest() != manifest["sha256"]:
        raise RuntimeError("Eskom capture no longer matches its source checksum")
    frame = parse_generation_csv(content)
print("Reported hourly observations:", len(frame), "Scope:", frame.attrs["scope"])
Reported hourly observations: 5856 Scope: Eskom-owned or contracted renewables; embedded generation excluded
2. Plot one published week in the source clock#
Labels are hour beginning in South African time (UTC+02:00). The source uses reported hourly MW. The connector does not infer a finer sampling definition or integrate those reports into independently metered energy. Missing values and signed observations remain unchanged.
first = frame.timestamp.min()
week = frame.loc[frame.timestamp.lt(first + pd.Timedelta(days=7))]
wide = week.pivot(index="timestamp", columns="technology", values="value")
wide.index = wide.index.tz_convert("Africa/Johannesburg")
fig, ax = plt.subplots(figsize=(11, 4.5), layout="constrained")
wide.rename(
    columns={
        "solar_pv": "Solar PV",
        "solar_thermal": "CSP",
        "wind": "Wind",
        "other_renewable": "Other renewable",
    }
).plot(ax=ax, linewidth=1.0)
ax.set(
    title="Eskom-owned/contracted renewables: a real published week",
    ylabel="Reported hourly power [MW]",
    xlabel="South African Standard Time (UTC+02:00)",
)
ax.grid(alpha=0.2)
ax.legend(title="Technology", ncol=2)
plt.show()
3. Preserve export identity when requesting revisions#
EskomClient(http).generation(start, end) filters inclusive local dates
inside the latest file. It does not promise arbitrary historical coverage.
Pass a verified official url= for another archived export, and preserve
each file’s request record and checksum with the normalized observations.
Total running time of the script: (0 minutes 0.130 seconds)