Note
Go to the end to download the full example code.
Equipment failure rates and maintenance priorities#
Use actual, attributed source snapshots for industrial equipment, PV components, offshore wind and drives. Different populations and exposure units remain separate. The budget uses illustrative costs, not measured financial outcomes.
See the failure-rate guide.
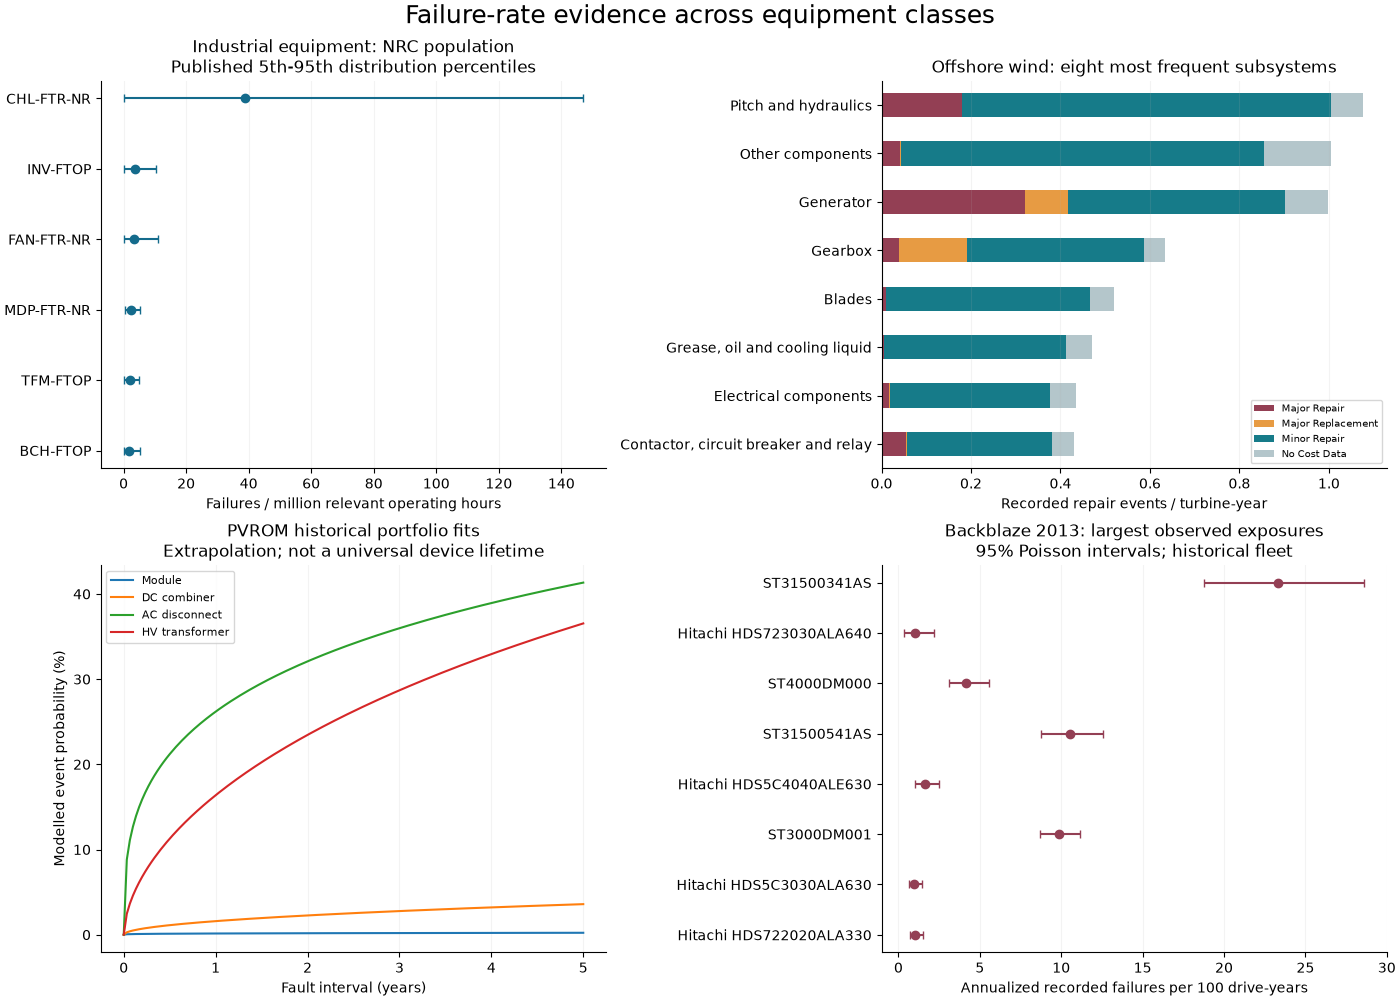
Evaluated 449 usable source records
Illustrative EUR/year for 100 turbines: 2280100
device
Gearbox                       815650.0
Generator                     674450.0
Pitch and hydraulics          146500.0
Other components               89100.0
Power supply and converter     72000.0
Name: expected_annual_cost_eur, dtype: float64
import matplotlib.pyplot as plt

from energy_analysis.failure_reliability import (
    analyse_database,
    plot_failure_analysis,
    wind_maintenance_budget,
)

results = analyse_database()
print(f"Evaluated {len(results)} usable source records")
budget = wind_maintenance_budget()
print("Illustrative EUR/year for 100 turbines:", round(budget.expected_annual_cost_eur.sum()))
print(budget.groupby("device")["expected_annual_cost_eur"].sum().nlargest(5))
figure = plot_failure_analysis()
plt.show()
Total running time of the script: (0 minutes 0.346 seconds)