Note
Go to the end to download the full example code.
PV reliability methods: trackers, sensors and surviving devices#
Synthetic inputs demonstrate missing-data bounds, independent sensor quality, and censored first-event survival. These are not measurements from a real plant or reconstructed BFH observations. Pass validated, aligned SCADA or CMMS data.
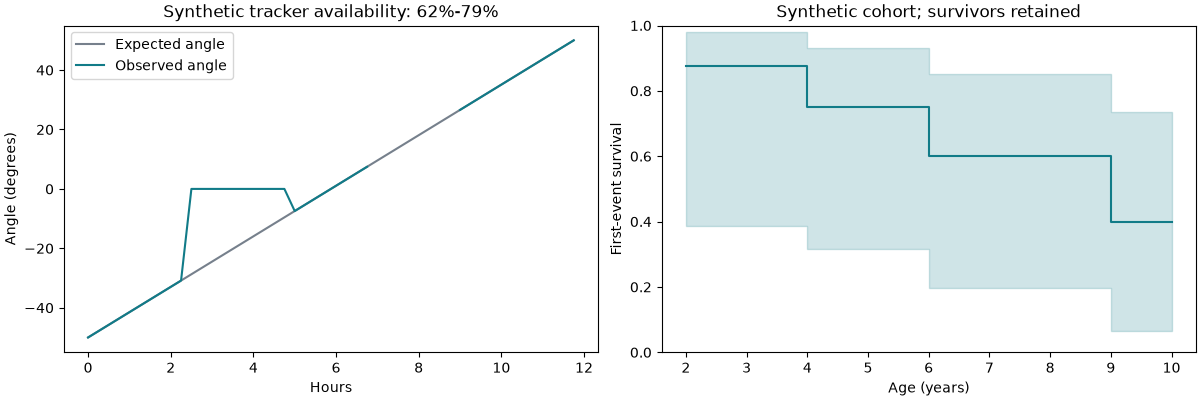
Synthetic tracker: {'eligible_hours': 12.0, 'available_hours': 7.5, 'unavailable_hours': 2.5, 'unknown_hours': 2.0, 'excluded_hours': 0.0, 'unknown_eligibility_hours': 0.0, 'lower': 0.625, 'upper': 0.7916666666666666, 'observed': 0.75, 'coverage': 0.8333333333333334}
Synthetic WST: {'scheduled_hours': 12.0, 'data_coverage': 0.9166666666666666, 'valid_data_fraction': 0.6666666666666666, 'invalid_observed_hours': 3.0, 'missing_hours': 1.0}
import matplotlib.pyplot as plt
import numpy as np

from energy_methods.pv_device_reliability import (
    kaplan_meier_survival,
    sensor_serviceability,
    tracker_availability,
)

reference = np.linspace(-50, 50, 48)
actual = reference.copy()
actual[10:20] = 0  # A synthetic stalled interval.
actual[28:36] = np.nan  # Unknown state, not a diagnosed failure.
hours = np.full(48, 0.25)
result = tracker_availability(actual, reference, np.full(48, 600), hours)
print("Synthetic tracker:", result.to_dict())

temperature = np.full(48, 25.0)
temperature[8:12] = np.nan
quality = np.ones(48, dtype=bool)
quality[30:42] = False  # External QC identified invalid measurements.
print("Synthetic WST:", sensor_serviceability(temperature, hours, quality_valid=quality))

survival = kaplan_meier_survival([2, 4, 4, 6, 7, 9, 10, 10], [1, 1, 0, 1, 0, 1, 0, 0])
fig, axes = plt.subplots(1, 2, figsize=(12, 4), layout="constrained")
axes[0].plot(np.arange(48) / 4, reference, label="Expected angle", color="#76808c")
axes[0].plot(np.arange(48) / 4, actual, label="Observed angle", color="#117b88")
axes[0].set(
    title=f"Synthetic tracker availability: {result.lower:.0%}-{result.upper:.0%}",
    xlabel="Hours",
    ylabel="Angle (degrees)",
)
axes[0].legend()
axes[1].step(survival.age, survival.survival, where="post", color="#117b88")
axes[1].fill_between(
    survival.age, survival.lower, survival.upper, step="post", alpha=0.2, color="#117b88"
)
axes[1].set(
    title="Synthetic cohort; survivors retained",
    xlabel="Age (years)",
    ylabel="First-event survival",
    ylim=(0, 1),
)
plt.show()
Total running time of the script: (0 minutes 0.132 seconds)