Note
Go to the end to download the full example code.
One site: climate metadata and practical next steps#
Look up KGPV, JRC, ML21 and PVCZ context for a coordinate near Rengo, Chile. This is an illustrative coordinate, not a surveyed PV plant. The offline bundle keeps all native columns for nearby source rows, rather than only map labels.
Download the runnable site bundle and
read the site lookup guide for full
catalogue use, units, source access, tie handling and operational interpretation.
import json
from pathlib import Path

import matplotlib.pyplot as plt
import pandas as pd

from energy_analysis.climate_comparison.site import load_site_example, site_climate_profile
One call returns four schemes and their metadata#
The 50 km threshold is an explicit search limit, not a claim of scientific representativeness. The query never selects a farther complete row to hide missing data, and it reports ambiguous labels at equally nearest source points.
catalogues, manifest, model = load_site_example(Path("."))
latitude, longitude = manifest["site"]["latitude"], manifest["site"]["longitude"]
profile = site_climate_profile(
    latitude,
    longitude,
    catalogues=catalogues,
    source_metadata=manifest["sources"],
    jrc_model=model,
    radius_km=50,
)
rows = []
for scheme, result in profile["classifications"].items():
    rows.append(
        {
            "scheme": scheme,
            "status": result["status"],
            "code": result["code"],
            "distance_km": result["distance_km"],
            "period": result["source"]["period"],
            "resolution": result["source"]["resolution"],
        }
    )
print(pd.DataFrame(rows).to_string(index=False))
scheme  status  code  distance_km                                      period                       resolution
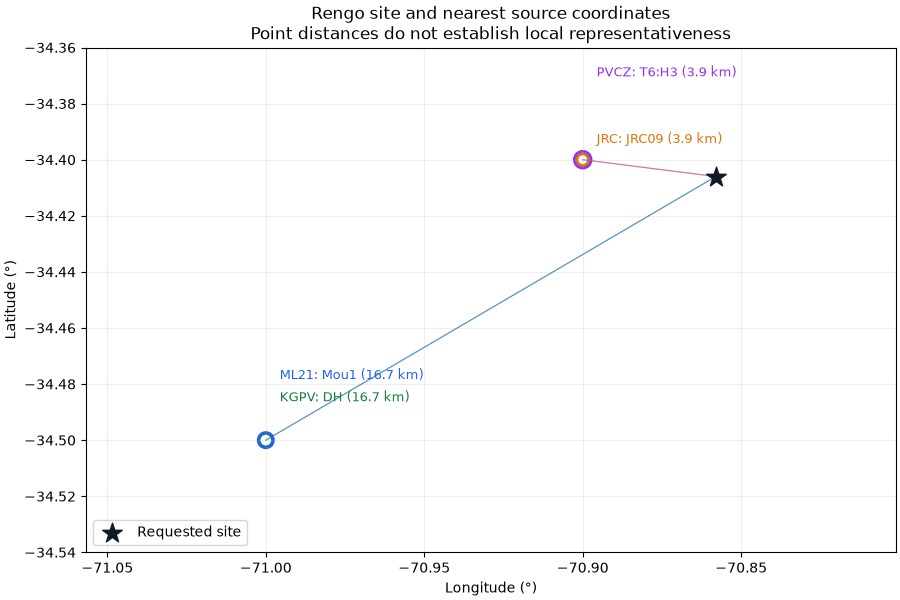
   JRC matched JRC09     3.910633                                   2005-2023                       0.1 degree
  KGPV matched    DH    16.696486 Mixed source climatologies; see publication                       0.5 degree
  ML21 matched  Mou1    16.696486 Mixed source climatologies; see publication                       0.5 degree
  PVCZ matched T6:H3     3.910633                                   2010-2018 0.25 degree; rounded coordinates
Inspect where the metadata comes from#
KGPV and ML21 share the same reference workbook here, so their source markers overlap. PVCZ can contain several records at the same rounded coordinates; the returned candidates preserve all such rows. No marker is moved to the site.
fig, ax = plt.subplots(figsize=(9, 6), layout="constrained")
ax.scatter(longitude, latitude, marker="*", s=220, c="#111827", label="Requested site", zorder=5)
colors = {"JRC": "#d97706", "KGPV": "#15803d", "ML21": "#2563eb", "PVCZ": "#9333ea"}
for index, (scheme, result) in enumerate(profile["classifications"].items()):
    for candidate in result["candidates"]:
        ax.scatter(
            candidate["lon"],
            candidate["lat"],
            s=70 + index * 25,
            facecolors="none",
            edgecolors=colors[scheme],
            linewidths=2,
        )
        ax.plot(
            [longitude, candidate["lon"]],
            [latitude, candidate["lat"]],
            color=colors[scheme],
            alpha=0.5,
            linewidth=0.8,
        )
    if result["candidates"]:
        candidate = result["candidates"][0]
        ax.annotate(
            f"{scheme}: {result['code']} ({result['distance_km']:.1f} km)",
            (candidate["lon"], candidate["lat"]),
            xytext=(10, 12 + index * 16),
            textcoords="offset points",
            color=colors[scheme],
            fontsize=9,
        )
ax.set(
    xlabel="Longitude (°)",
    ylabel="Latitude (°)",
    title=(
        "Rengo site and nearest source coordinates\n"
        "Point distances do not establish local representativeness"
    ),
)
ax.margins(0.4)
ax.grid(alpha=0.2)
ax.legend(loc="lower left")
plt.show()
Inspect the complete fields and provenance#
Each entry contains its label, all source-row fields, units, source URL/hash, period, native resolution and interpretation. The JRC entry also records the frozen model, centroid meaning and whether inputs exceed its training range. Missing numerical values serialize as JSON null, never invented zeros.
for scheme, result in profile["classifications"].items():
    print(f"\n{scheme}: {result['label']}")
    print("Source:", json.dumps(result["source"], ensure_ascii=False, indent=2))
    for candidate in result["candidates"]:
        details = [
            {"field": name, "value": value, "units": result["field_metadata"][name]["units"]}
            for name, value in candidate.items()
        ]
        print(pd.DataFrame(details).to_string(index=False))

# Save the complete record when running locally:
# Path("my_site_climate.json").write_text(json.dumps(profile, indent=2, allow_nan=False))
JRC: POA 2101 kWh/m²/year; module 46.1 °C
Source: {
  "url": "https://jeodpp.jrc.ec.europa.eu/ftp/jrc-opendata/PVGIS/climatic-zones-pv/means-global.csv",
  "sha256": "55aa6751bdf5e05351a65aad4271125caeac443b4d45287a129183249856f19a",
  "size_bytes": 211755040,
  "period": "2005-2023",
  "resolution": "0.1 degree",
  "licence": "European Commission reuse notice; attribution required",
  "source": "JRC PVGIS/ERA5 climate catalogue",
  "sample_support": {
    "latitude": -34.406,
    "longitude": -70.858,
    "radius_km": 75.0
  },
  "selection": "Every native row within 75 km of the declared Rengo coordinate; all columns retained",
  "original_rows": 1452132,
  "retained_rows": 172,
  "columns": [
    "lat",
    "lon",
    "tilt",
    "G",
    "Tamb",
    "Tmod",
    "Tw",
    "E",
    "eff",
    "suff"
  ],
  "sample_sha256": "707f92de6dc0a1bce8ee0b20d9adc70d45ae231b5b614ed2ee14d4149f33b0d8",
  "reference_ids": [
    "jrc_2025_climate_dataset",
    "medina_2026_pv_climates"
  ]
}
field       value                                  units
  lat  -34.400000                           degree north
  lon  -70.900000                            degree east
 tilt   31.000000            degree, source optimal tilt
    G 2255.724365            kWh/m²/year, plane-of-array
 Tamb   14.507441                     degC, ambient mean
 Tmod   22.030064                      degC, module mean
   Tw   41.953919       degC, irradiance-weighted module
    E 2128.277632  kWh/kWp/year, modelled specific yield
  eff    0.943501     source-native efficiency statistic
 suff    0.632285 source-native; see provider definition

KGPV: Temperate; merged high irradiation class
Source: {
  "url": "https://ars.els-cdn.com/content/image/1-s2.0-S0960148125013473-mmc1.xlsx",
  "sha256": "d8eb4c55df1e5e937f8460dada0fdb9f3b52dbc8cb79da14aa44319c1ab46891",
  "size_bytes": 10777807,
  "period": "Mixed source climatologies; see publication",
  "resolution": "0.5 degree",
  "licence": "Article CC BY; attributed supplementary-data extracts",
  "source": "ML21 publisher supplementary workbook",
  "sample_support": {
    "latitude": -34.406,
    "longitude": -70.858,
    "radius_km": 75.0
  },
  "selection": "Every native row within 75 km of the declared Rengo coordinate; all columns retained",
  "original_rows": 55418,
  "retained_rows": 8,
  "columns": [
    "lat",
    "lon",
    "Tann",
    "Tmax",
    "Tmin",
    "DTRann",
    "Pann",
    "Pmin",
    "RHann",
    "GHIann",
    "GHImax",
    "GHImin",
    "UVann",
    "WSann",
    "Yf",
    "ml21_zone",
    "KGPV",
    "kgpv_zone"
  ],
  "sample_sha256": "81941d33566c5cd7aeb4f4c8cb24b9fd10171edbab547e2b333ddd48c27064b1",
  "reference_ids": [
    "triana_2026_ml_climates"
  ]
}
    field             value                                  units
      lat             -34.5                           degree north
      lon             -71.0                            degree east
     Tann         13.023522                                   degC
     Tmax         19.492742                                   degC
     Tmin          7.037097                                   degC
   DTRann         11.312366                                   degC
     Pann        598.324834 source-native; see provider definition
     Pmin          1.913833 source-native; see provider definition
    RHann         68.274498 source-native; see provider definition
   GHIann  238071234.984443        J/m², native workbook statistic
   GHImax   31681346.063567        J/m², native workbook statistic
   GHImin    7846540.387097        J/m², native workbook statistic
    UVann   13789838.333302        J/m², native workbook statistic
    WSann          1.232025 source-native; see provider definition
       Yf          1825.495            kWh/kWp/year, source target
ml21_zone              Mou1 source-native; see provider definition
     KGPV                 5 source-native; see provider definition
kgpv_zone                DH source-native; see provider definition

ML21: Mountainous; published subtype 1
Source: {
  "url": "https://ars.els-cdn.com/content/image/1-s2.0-S0960148125013473-mmc1.xlsx",
  "sha256": "d8eb4c55df1e5e937f8460dada0fdb9f3b52dbc8cb79da14aa44319c1ab46891",
  "size_bytes": 10777807,
  "period": "Mixed source climatologies; see publication",
  "resolution": "0.5 degree",
  "licence": "Article CC BY; attributed supplementary-data extracts",
  "source": "ML21 publisher supplementary workbook",
  "sample_support": {
    "latitude": -34.406,
    "longitude": -70.858,
    "radius_km": 75.0
  },
  "selection": "Every native row within 75 km of the declared Rengo coordinate; all columns retained",
  "original_rows": 55418,
  "retained_rows": 8,
  "columns": [
    "lat",
    "lon",
    "Tann",
    "Tmax",
    "Tmin",
    "DTRann",
    "Pann",
    "Pmin",
    "RHann",
    "GHIann",
    "GHImax",
    "GHImin",
    "UVann",
    "WSann",
    "Yf",
    "ml21_zone",
    "KGPV",
    "kgpv_zone"
  ],
  "sample_sha256": "81941d33566c5cd7aeb4f4c8cb24b9fd10171edbab547e2b333ddd48c27064b1",
  "reference_ids": [
    "triana_2026_ml_climates"
  ]
}
    field             value                                  units
      lat             -34.5                           degree north
      lon             -71.0                            degree east
     Tann         13.023522                                   degC
     Tmax         19.492742                                   degC
     Tmin          7.037097                                   degC
   DTRann         11.312366                                   degC
     Pann        598.324834 source-native; see provider definition
     Pmin          1.913833 source-native; see provider definition
    RHann         68.274498 source-native; see provider definition
   GHIann  238071234.984443        J/m², native workbook statistic
   GHImax   31681346.063567        J/m², native workbook statistic
   GHImin    7846540.387097        J/m², native workbook statistic
    UVann   13789838.333302        J/m², native workbook statistic
    WSann          1.232025 source-native; see provider definition
       Yf          1825.495            kWh/kWp/year, source target
ml21_zone              Mou1 source-native; see provider definition
     KGPV                 5 source-native; see provider definition
kgpv_zone                DH source-native; see provider definition

PVCZ: Module stress 34-<39 °C; humidity 4.1-<5.9 g/kg
Source: {
  "url": "https://raw.githubusercontent.com/toddkarin/pvcz/aa89fab8d1d66f46f4ea8575e2452aa75a927535/pvcz/PVCZ-2019_ver0p2_world_PV_climate_stressors_and_zones.csv",
  "sha256": "14e7e06010620f8054b3ba7ee49256bc4d26c017c51da2d188d9753cff7d9801",
  "size_bytes": 48588578,
  "period": "2010-2018",
  "resolution": "0.25 degree; rounded coordinates",
  "licence": "MIT",
  "commit": "aa89fab8d1d66f46f4ea8575e2452aa75a927535",
  "source": "PVCZ author stressor catalogue",
  "sample_support": {
    "latitude": -34.406,
    "longitude": -70.858,
    "radius_km": 75.0
  },
  "selection": "Every native row within 75 km of the declared Rengo coordinate; all columns retained",
  "original_rows": 230742,
  "retained_rows": 28,
  "columns": [
    "lat",
    "lon",
    "T_ambient_mean",
    "T_ambient_min",
    "T_ambient_max",
    "T_equiv_rack_0p1eV",
    "T_equiv_rack_0p3eV",
    "T_equiv_rack_0p5eV",
    "T_equiv_rack_0p7eV",
    "T_equiv_rack_0p9eV",
    "T_equiv_rack_1p1eV",
    "T_equiv_rack_1p3eV",
    "T_equiv_rack_1p5eV",
    "T_equiv_rack_1p7eV",
    "T_equiv_rack_1p9eV",
    "T_equiv_rack_2p1eV",
    "T_equiv_roof_0p1eV",
    "T_equiv_roof_0p3eV",
    "T_equiv_roof_0p5eV",
    "T_equiv_roof_0p7eV",
    "T_equiv_roof_0p9eV",
    "T_equiv_roof_1p1eV",
    "T_equiv_roof_1p3eV",
    "T_equiv_roof_1p5eV",
    "T_equiv_roof_1p7eV",
    "T_equiv_roof_1p9eV",
    "T_equiv_roof_2p1eV",
    "T_velocity_rack",
    "T_velocity_roof",
    "specific_humidity_mean",
    "specific_humidity_rms",
    "GHI_mean",
    "wind_speed_rms",
    "wind_speed_max",
    "ASCE 7-16 MRI 25-Year",
    "KG_zone",
    "KG_class_0",
    "KG_class_1",
    "KG_class_2",
    "KG_class_02",
    "T_equiv_rack_1p1eV_zone",
    "T_equiv_roof_1p1eV_zone",
    "specific_humidity_mean_zone",
    "ASCE 7-16 MRI 25-Year_zone",
    "KG_numeric_zone",
    "pvcz",
    "pvcz_labeled",
    "wind_speed",
    "wind_speed_zone"
  ],
  "sample_sha256": "eb36404e5b452f5ad2245e7e5345c416d665c55ce489816309f3bab42cc370f8",
  "reference_ids": [
    "karin_2019_pvcz",
    "karin_pvcz_software"
  ]
}
                      field value                                                units
                        lat -34.4                                         degree north
                        lon -70.9                                          degree east
             T_ambient_mean  16.7                                                 degC
              T_ambient_min  -2.7                                                 degC
              T_ambient_max  37.4                                                 degC
         T_equiv_rack_0p1eV  22.9 degC, source-specific activation energy and mounting
         T_equiv_rack_0p3eV  25.7 degC, source-specific activation energy and mounting
         T_equiv_rack_0p5eV  28.6 degC, source-specific activation energy and mounting
         T_equiv_rack_0p7eV  31.5 degC, source-specific activation energy and mounting
         T_equiv_rack_0p9eV  34.0 degC, source-specific activation energy and mounting
         T_equiv_rack_1p1eV  36.2 degC, source-specific activation energy and mounting
         T_equiv_rack_1p3eV  38.1 degC, source-specific activation energy and mounting
         T_equiv_rack_1p5eV  39.6 degC, source-specific activation energy and mounting
         T_equiv_rack_1p7eV  41.0 degC, source-specific activation energy and mounting
         T_equiv_rack_1p9eV  42.1 degC, source-specific activation energy and mounting
         T_equiv_rack_2p1eV  43.1 degC, source-specific activation energy and mounting
         T_equiv_roof_0p1eV  28.5 degC, source-specific activation energy and mounting
         T_equiv_roof_0p3eV  34.4 degC, source-specific activation energy and mounting
         T_equiv_roof_0p5eV  40.4 degC, source-specific activation energy and mounting
         T_equiv_roof_0p7eV  45.6 degC, source-specific activation energy and mounting
         T_equiv_roof_0p9eV  49.8 degC, source-specific activation energy and mounting
         T_equiv_roof_1p1eV  53.0 degC, source-specific activation energy and mounting
         T_equiv_roof_1p3eV  55.7 degC, source-specific activation energy and mounting
         T_equiv_roof_1p5eV  57.8 degC, source-specific activation energy and mounting
         T_equiv_roof_1p7eV  59.6 degC, source-specific activation energy and mounting
         T_equiv_roof_1p9eV  61.1 degC, source-specific activation energy and mounting
         T_equiv_roof_2p1eV  62.5 degC, source-specific activation energy and mounting
            T_velocity_rack  2.54                                            degC/hour
            T_velocity_roof  3.83                                            degC/hour
     specific_humidity_mean  5.11                                                 g/kg
      specific_humidity_rms  2.26                                                 g/kg
                   GHI_mean  5.57                                           kWh/m²/day
             wind_speed_rms  2.29               source-native; see provider definition
             wind_speed_max  12.2               source-native; see provider definition
      ASCE 7-16 MRI 25-Year  -5.0               source-native; see provider definition
                    KG_zone   Csb               source-native; see provider definition
                 KG_class_0     C               source-native; see provider definition
                 KG_class_1     s               source-native; see provider definition
                 KG_class_2     b               source-native; see provider definition
                KG_class_02    Cb               source-native; see provider definition
    T_equiv_rack_1p1eV_zone     5               source-native; see provider definition
    T_equiv_roof_1p1eV_zone     8               source-native; see provider definition
specific_humidity_mean_zone     2               source-native; see provider definition
 ASCE 7-16 MRI 25-Year_zone     0               source-native; see provider definition
            KG_numeric_zone    17               source-native; see provider definition
                       pvcz    25               source-native; see provider definition
               pvcz_labeled T6:H3               source-native; see provider definition
                 wind_speed  -5.0             m/s, source 25-year recurrence statistic
            wind_speed_zone     0               source-native; see provider definition
Use the metadata: screen mounting-related thermal stress#
PVCZ supplies modelled temperatures for both open-rack and close-roof mounting at several activation energies. Compare the two source values at 1.1 eV to decide whether mounting deserves a dedicated thermal study. This is a source model comparison at the selected grid point, not a measured temperature change or a degradation-rate prediction for this site.
pvcz_context = profile["classifications"]["PVCZ"]
if pvcz_context["status"] == "matched" and len(pvcz_context["candidates"]) == 1:
    native = pvcz_context["candidates"][0]
    rack = native["T_equiv_rack_1p1eV"]
    roof = native["T_equiv_roof_1p1eV"]
    if rack is not None and roof is not None:
        fig, ax = plt.subplots(figsize=(7, 4), layout="constrained")
        bars = ax.bar(["Open rack", "Close roof"], [rack, roof], color=["#2563eb", "#d97706"])
        ax.bar_label(bars, fmt="%.1f °C", padding=4)
        ax.set(
            ylabel="Arrhenius-equivalent module temperature (°C)",
            ylim=(0, max(rack, roof) * 1.2),
            title="Use the source metadata: mounting stress comparison\n"
            "PVCZ modelled source point, 2010-2018, activation energy 1.1 eV",
        )
        plt.show()
        print(f"Source-model close-roof minus open-rack temperature: {roof - rack:.1f} °C")
        print("Next: model the actual mounting and ventilation with local weather.")
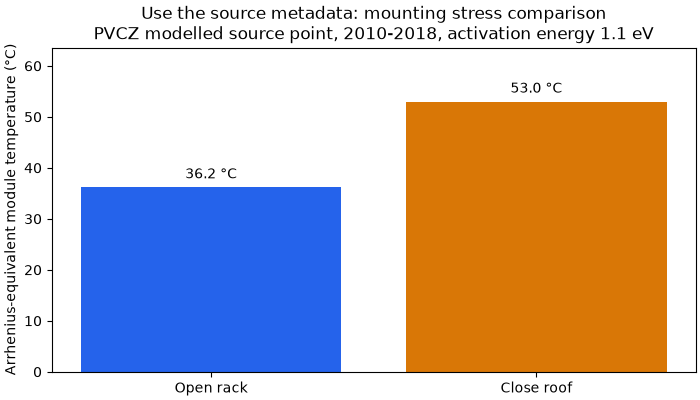
Source-model close-roof minus open-rack temperature: 16.8 °C
Next: model the actual mounting and ventilation with local weather.
What to do with these results#
KGPV: group sites into climate peers before a fleet performance comparison.
JRC: examine irradiation and module-temperature conditions, then use local weather and the real tilt/mounting for a yield or thermal-loss model.
ML21: stratify benchmarking by PV-climate family; keep technology, design and data-quality differences under control.
PVCZ: use thermal/humidity stress as input to a qualification or inspection plan, then confirm mechanisms with module and field evidence.
Degradation rate: supply module calibration and hourly temperature/RH/UV stresses to the separate degradation model. A class is not a %/year rate.
Inspect sources before acting. These products use different periods and model assumptions; their IDs have no cross-scheme numeric equivalence. If any entry is missing, outside the radius or ambiguous, resolve it with appropriate local data instead of widening the search just to obtain a label.
for scheme, result in profile["classifications"].items():
    print(f"{scheme}: {result['use']} {result['limitation']}")
for step in profile["next_steps"]:
    print("Next:", step)
JRC: Screen POA and module-temperature conditions; verify mounting and tilt before yield modelling. PVGIS optimal-tilt model inputs and refitted classes are not operating-plant measurements.
KGPV: Group sites into broad climate/irradiation peers before comparing performance. A broad class does not give hourly expected power or a measured loss rate.
ML21: Stratify performance benchmarks by published PV climate family; validate peers with local data. Published labels and a new ML21 refit have different identities; native feature conventions matter.
PVCZ: Screen thermal/humidity stress and plan module qualification or targeted inspection. Stress classes are not degradation %/year, failure diagnoses or warranted lifetimes.
Next: Check distance, native resolution, period and terrain before assigning a site class.
Next: Retrieve local hourly weather and measured PV data; compare sites with compatible design and data quality.
Next: For degradation %/year, use module calibration and temperature/RH/UV/cycles; do not convert a class ID to a rate.
Next: Validate modelled risk against observed performance loss and inspection evidence before operational decisions.
Query a different site#
The included files are a bounded Rengo subset, so arbitrary sites require full
source catalogues. site_climate_profile accepts the existing JRC/ML21/PVCZ
reader outputs; the guide shows the download/read calls and exact metadata.
The same query with radius_km=0.1 shows an honest no-nearby-source result.
strict = site_climate_profile(
    latitude,
    longitude,
    catalogues=catalogues,
    source_metadata=manifest["sources"],
    jrc_model=model,
    radius_km=0.1,
)
print({name: entry["status"] for name, entry in strict["classifications"].items()})
{'JRC': 'outside_radius', 'KGPV': 'outside_radius', 'ML21': 'outside_radius', 'PVCZ': 'outside_radius'}
Total running time of the script: (0 minutes 0.191 seconds)