Note
Go to the end to download the full example code.
Portugal’s October 2026 wind/solar shortfall: audit rounded import statistics#
News trigger: Portugal’s TSO REN reported on 3 November 2026 that renewables supplied 62% of January-October consumption, while net imports supplied 24%. October alone saw 47% renewables, 13% non-renewables and 40% net imports. October productivity indices were 0.58 hydro, 0.61 wind and 1.05 solar (historical reference 1).
Business question: Can investors use rounded cumulative statistics to estimate monthly exposure to imported electricity? Published precision matters.
Evidence: Actual REN published, integer-rounded percentages, not invented time series. One SYNTHETIC scenario input is October consumption assumed equal to 4.50 TWh; it is not a measured REN monthly demand observation. The January-September demand (40.5 TWh) is REN’s rounded observation.
Primary sources:
REN, 2 October 2026: https://www.ren.pt/en-gb/media/news/portugal-breaks-electricity-consumption-record-in-the-first-nine-months
REN, 3 November 2026: https://www.ren.pt/en-gb/media/news/renewables-account-for-62-per-cent-of-electricity-consumption-after-10-months
This is an accounting/data-quality screen, not hourly dispatch, electricity price optimization or emissions attribution. See the dedicated documentation.
import matplotlib.pyplot as plt

from energy_methods.mix_rounding import infer_incremental_month_share

# TSO PUBLISHED OBSERVATIONS: rounded percentages of national consumption.
# Gas is intentionally omitted: cumulative gas vs October non-renewables are
# not guaranteed to be the same statistical category.
labels = ("Renewable", "Net imports")
jan_sep = (64.0, 22.0)
jan_oct = (62.0, 24.0)
october = (47.0, 40.0)
# REN's PUBLISHED October resource productivity relative to climatology = 1.
productivity = {"Hydro": 0.58, "Wind": 0.61, "Solar PV": 1.05}

fig, ax = plt.subplots(figsize=(9, 4.5), layout="constrained")
x = list(range(len(labels)))
for offset, values, period in (
    (-0.26, jan_sep, "Jan-Sep 2026"),
    (0.0, jan_oct, "Jan-Oct 2026"),
    (0.26, october, "Oct 2026 only"),
):
    ax.bar([i + offset for i in x], values, width=0.25, label=period)
ax.set(
    xticks=x,
    xticklabels=labels,
    ylabel="Share of consumption (%)",
    title="REN published shares (rounded; different reporting periods)",
)
ax.legend()
plt.show()
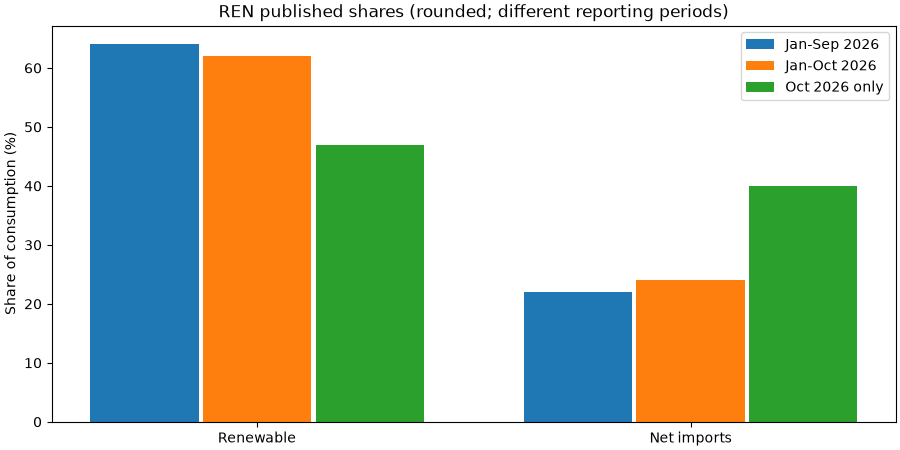
The percentages above are OBSERVED/REPORTED. October demand below is an explicitly SYNTHETIC scenario: 4.50 TWh (not a REN measurement). Intervals account for rounding, NOT forecast confidence or uncertainty.
month_demand_twh = 4.50  # SYNTHETIC illustrative value
intervals = [
    infer_incremental_month_share(
        preceding_demand_twh=40.5,  # REN observation rounded to 0.1 TWh
        new_month_demand_twh=month_demand_twh,  # scenario
        preceding_share_pct=prior,
        cumulative_share_pct=after,
        share_rounding_pp=0.5,
        preceding_demand_rounding_twh=0.05,
    )
    for prior, after in zip(jan_sep, jan_oct, strict=True)
]
fig, axes = plt.subplots(1, 2, figsize=(12, 4.1), layout="constrained")
for index, (label, inferred, independently_reported) in enumerate(
    zip(labels, intervals, october, strict=True)
):
    axes[0].plot(
        [index, index],
        [inferred.minimum_pct, inferred.maximum_pct],
        marker="_",
        linewidth=5,
    )
    axes[0].plot(index, inferred.central_pct, marker="o")
    axes[0].plot(index, independently_reported, marker="x", markersize=10, color="black")
    print(
        f"{label}: central implied {inferred.central_pct:.2f}%; "
        f"rounding envelope {inferred.minimum_pct:.2f}-{inferred.maximum_pct:.2f}%; "
        f"REN published October {independently_reported:.0f}%; "
        f"compatible={inferred.contains_reported(independently_reported)}"
    )
axes[0].set(
    xticks=list(range(len(labels))),
    xticklabels=labels,
    ylabel="October share of consumption (%)",
    title="Implied monthly shares: rounding envelopes",
)
axes[0].text(0.02, 0.02, "Black x = REN published October share", transform=axes[0].transAxes)
axes[1].bar(list(productivity), list(productivity.values()))
axes[1].axhline(1.0, linestyle="--", color="black", label="Historical reference")
axes[1].set(
    ylabel="REN October productivity index",
    title="Reported resource productivity",
)
axes[1].legend()
plt.show()
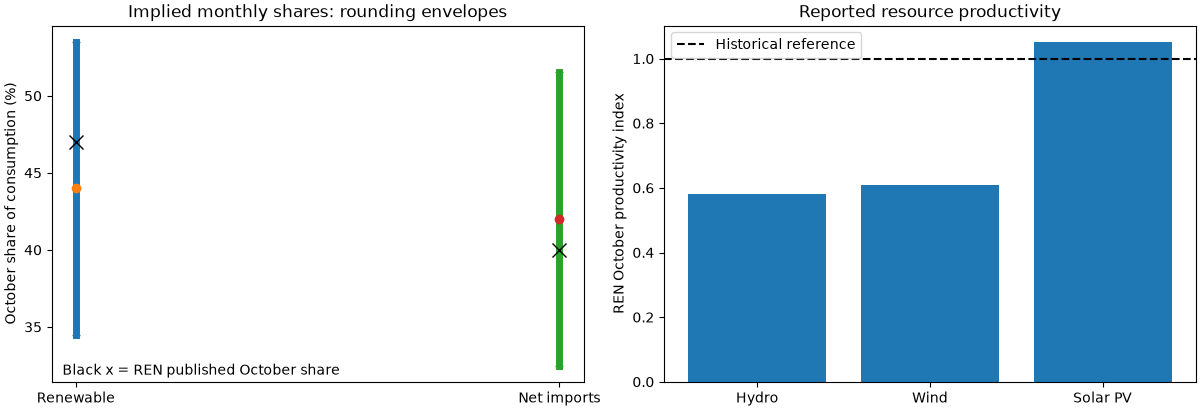
Renewable: central implied 44.00%; rounding envelope 34.47-53.51%; REN published October 47%; compatible=True
Net imports: central implied 42.00%; rounding envelope 32.49-51.53%; REN published October 40%; compatible=True
BOTH separately reported October percentages are compatible with rounding. Their relation is descriptive, not causal. No market price or BESS sizing claim is supported by these aggregated monthly news figures. Reproduce: uv run –no-sync python examples/analysis/plot_portugal_mix_rounding.py
Total running time of the script: (0 minutes 0.174 seconds)