Note
Go to the end to download the full example code.
Court Barton PV news: audit homes-powered and CO2-savings claims#
News, 5 November 2026: Recurrent Energy announced commercial operation of Court Barton, a 20 MWp solar plant in South Devon. Its announcement says the plant will power around 8,500 homes per year and avoid more than 6,200 tonnes of CO2 annually. Those are developer claims, not an observed generation or verified carbon-avoidance dataset.
Decision question: What annual electricity output and implied CO2 intensity do those claims require, across independent UK household usage benchmarks? Can a due-diligence analyst spot unit or boundary problems?
Sources: Recurrent Energy/Canadian Solar press release (5 Nov 2026), Ofgem updated 2026 typical domestic electricity consumption values, and DESNZ’s 2026 UK average-grid emissions factor (kgCO2e/kWh). The 2026 benchmark is not a marginal avoided-CO2 factor. All reported input values below have provenance in the method guide.
The charts are algebraic SCENARIOS, not measured annual generation, project production forecasts, actual avoided emissions, confidence intervals, or an accusation of an error in developer reporting.
import matplotlib.pyplot as plt

from energy_methods.pv_news_claims import audit_pv_news_claims

# Observed source MATERIAL, not measured performance:
# Recurrent Energy release, November 5 2026: 20 MWp, ~8,500 homes,
# >6,200 tonnes CO2/year. 6200 is a LOWER BOUND, not an exact value.
capacity_mwp = 20.0
homes_equivalent = 8500.0
avoided_floor_tonnes_co2 = 6200.0

# Published reference benchmarks rather than measured Court Barton demand:
# Ofgem's 2026 single-rate low/medium/high annual electricity usage values.
usage_scenarios = {"Low": 1600.0, "Medium": 2500.0, "High": 3800.0}
# DESNZ UK 2026 *average* location-based Scope-2 electricity factor.
uk_grid_average_kgco2e_per_kwh = 0.13096

results = {
    name: audit_pv_news_claims(
        capacity_mwp=capacity_mwp,
        homes_equivalent=homes_equivalent,
        annual_household_kwh=usage_kwh,
        avoided_co2_floor_tonnes=avoided_floor_tonnes_co2,
        grid_average_kgco2e_per_kwh=uk_grid_average_kgco2e_per_kwh,
    )
    for name, usage_kwh in usage_scenarios.items()
}

for name, result in results.items():
    print(
        f"Ofgem {name} household scenario: implied {result.equivalent_generation_mwh:,.0f} "
        f"MWh/year; {100 * result.dc_equivalent_capacity_factor:.1f}% DC-equivalent "
        f"full-load fraction; >{result.co2_floor_kg_per_kwh:.3f} kgCO2/kWh "
        "implied by press-release CO2 bound"
    )
Ofgem Low household scenario: implied 13,600 MWh/year; 7.8% DC-equivalent full-load fraction; >0.456 kgCO2/kWh implied by press-release CO2 bound
Ofgem Medium household scenario: implied 21,250 MWh/year; 12.1% DC-equivalent full-load fraction; >0.292 kgCO2/kWh implied by press-release CO2 bound
Ofgem High household scenario: implied 32,300 MWh/year; 18.4% DC-equivalent full-load fraction; >0.192 kgCO2/kWh implied by press-release CO2 bound
These three reference values are Ofgem consumption categories, NOT a probabilistic distribution of annual output or actual customer metering.
fig, axes = plt.subplots(1, 2, figsize=(11, 4.3), layout="constrained")
names = list(usage_scenarios)
axes[0].bar(names, [100 * results[n].dc_equivalent_capacity_factor for n in names])
axes[0].set(
    ylabel="Implied annual DC-equivalent full-load fraction (%)",
    xlabel="Ofgem 2026 household usage benchmark",
    title="Homes-powered claim → implied PV energy",
)
axes[0].axhline(100, linestyle="--", color="black", label="Physical annual ceiling")
axes[0].legend()

axes[1].bar(names, [results[n].co2_floor_kg_per_kwh for n in names])
axes[1].axhline(
    uk_grid_average_kgco2e_per_kwh,
    linestyle="--",
    color="black",
    label="DESNZ UK 2026 grid-average CO2e (different boundary)",
)
axes[1].set(
    ylabel="Lower bound on implied kg CO2/kWh",
    xlabel="Ofgem 2026 household usage benchmark",
    title="Claimed avoided CO2 / equivalent electricity",
)
axes[1].legend(fontsize=8)
plt.show()
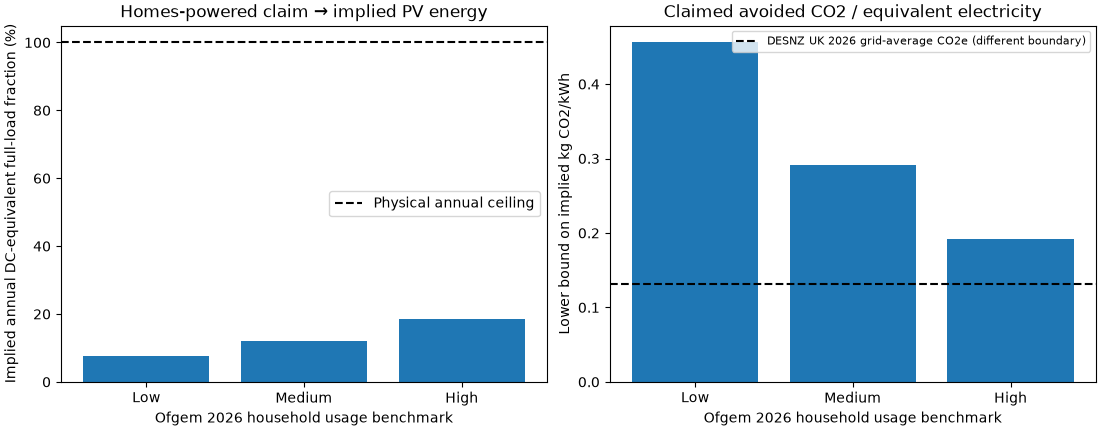
At the Ofgem medium representative annual usage (not necessarily the developer’s assumption), the energy equivalent is 21.25 GWh/year and the implied DC full-load fraction is 12.13%. The >6,200 t CO2 developer claim implies >0.292 kg CO2/kWh at this scenario; DESNZ’s 0.13096 kgCO2e/kWh is a grid average for corporate reporting, not a substitute for marginal avoided emissions. The values MUST NOT be used for an apples-to-apples validation of developer avoided CO2. Actual generation and the developer’s counterfactual emissions methodology would be needed for verification.
Reproduce from repo root: uv run –no-sync python examples/analysis/plot_court_barton_pv_claims.py
Total running time of the script: (0 minutes 0.122 seconds)