Note
Go to the end to download the full example code.
Failure database coverage and quality audit#
Load four versioned public source extracts without network access. The catalogue also records restricted sources and missing exposure denominators. Each published record keeps its population, units, source location and data-quality flags.
See the failure-rate guide.
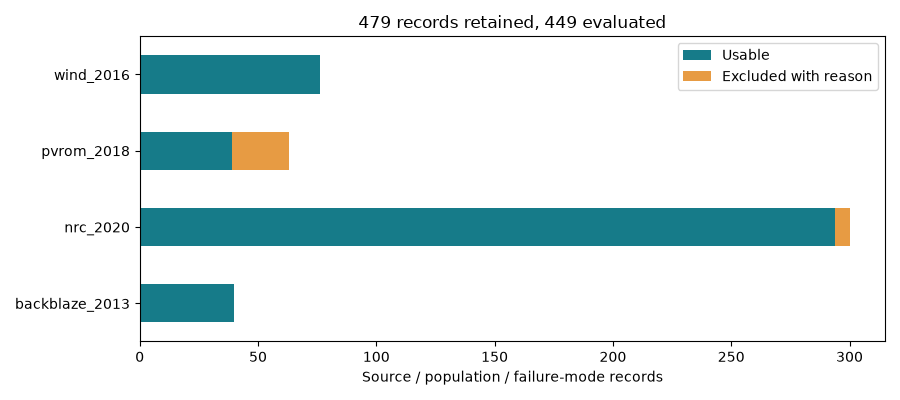
                records  usable_records  device_groups
source_id
backblaze_2013       40              40              1
nrc_2020            300             294             58
pvrom_2018           63              39             18
wind_2016            76              76             19
     source_id                                    access
      nrc_2020                            public release
    pvrom_2018                            public release
     wind_2016                            public release
backblaze_2013                            public release
         oreda                              subscription
     epri_bess                          public incidents
          crew published aggregates; restricted raw data
    pvrom_2020        public report; restricted raw data
import matplotlib.pyplot as plt

from energy_data_retrieval.failure_database import database_coverage, source_catalogue

coverage = database_coverage().set_index("source_id")
print(coverage[["records", "usable_records", "device_groups"]])
print(source_catalogue()[["source_id", "access"]].to_string(index=False))
plot = coverage[["usable_records"]].rename(columns={"usable_records": "Usable"})
plot["Excluded with reason"] = coverage.records - coverage.usable_records
ax = plot.plot.barh(stacked=True, figsize=(9, 4), color=["#167b89", "#e79b43"])
ax.set(
    xlabel="Source / population / failure-mode records",
    ylabel="",
    title="479 records retained, 449 evaluated",
)
plt.tight_layout()
plt.show()
Total running time of the script: (0 minutes 0.104 seconds)