Note
Go to the end to download the full example code.
AEMO: a full day of real dispatch-unit SCADA#
Read 288 five-minute dispatch labels for each of three real Australian units from AEMO’s public NEMWeb archive. The checked-in sample contains 864 original measurement rows from 27 October 2026 in NEM time, with retrieval metadata and checksums. This example builds offline; it does not require an API key.
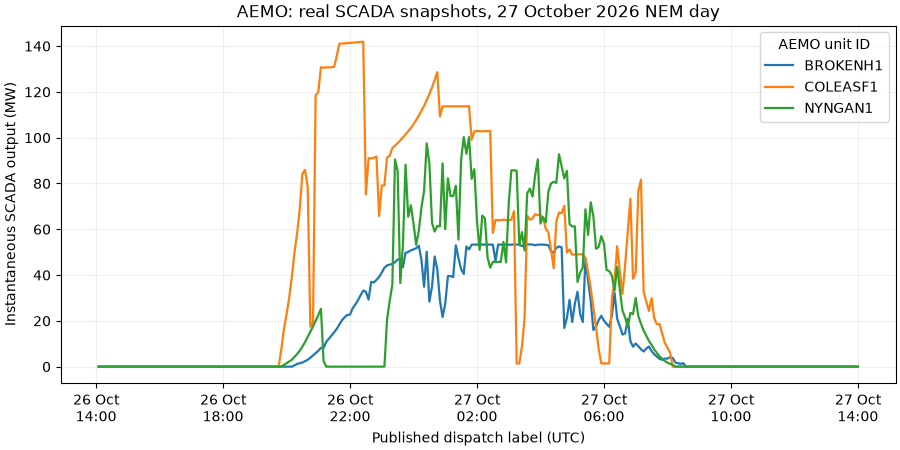
The plotted values are instantaneous SCADA MW, measured at the start of the dispatch interval. They are not five-minute means or settlement energy. We retain the published dispatch label, converted from fixed AEST (UTC+10) to UTC. The archive is not a complete inventory of Australian generation, and DUIDs must be joined to an official unit registry before assigning technology or distinguishing generators from loads.
Source: AEMO dispatch-unit SCADA data dictionary and NEMWeb daily archives.
Download the real CSV,
provenance manifest, or
all generation examples with their data.
import hashlib
import json
from pathlib import Path

import matplotlib.dates as mdates
import matplotlib.pyplot as plt

from energy_data_retrieval.sources.aemo import parse_dispatch_scada
1. Verify the captured public measurements#
The manifest records the exact upstream ZIP URL and SHA-256 as well as the selected CSV’s hash and the row-selection procedure. The source ZIP contains a full day of interval ZIPs; only three DUIDs are bundled here.
example_directory = (
    Path(globals().get("__file__", Path.cwd() / "plot_generation_aemo.py")).resolve().parent
)
data_directory = example_directory / "data"
if not data_directory.exists():
    # Sphinx-Gallery copies support files alongside the generated example.
    data_directory = example_directory
manifest = json.loads((data_directory / "generation_aemo_manifest.json").read_text())
raw = (data_directory / "generation_aemo_scada.csv").read_bytes()
if hashlib.sha256(raw).hexdigest() != manifest["subset_sha256"]:
    raise ValueError("The AEMO example subset differs from its provenance manifest")
print(f"Source: {manifest['source_url']}")
print(f"Retrieved: {manifest['retrieved_at_utc']}")
Source: https://nemweb.com.au/Reports/ARCHIVE/Dispatch_SCADA/PUBLIC_DISPATCHSCADA_20261027.zip
Retrieved: 2026-10-30T06:48:25.179585+00:00
2. Parse using the same connector as a live download#
parse_dispatch_scada accepts native MMS CSV, current interval ZIPs, and
the nested ZIP format used by daily archives. It keeps the native fields and
refuses duplicate dispatch-label/DUID keys.
generation = parse_dispatch_scada(raw)
print(generation.groupby("unit_id")["value"].agg(["count", "min", "max"]))
print(f"Distinct published dispatch labels: {generation.timestamp.nunique()}")
          count  min        max
unit_id
BROKENH1    288  0.0   53.39919
COLEASF1    288  0.0  141.90089
NYNGAN1     288  0.0  100.25000
Distinct published dispatch labels: 288
3. Compare measured output across the full day#
Values stay in MW, and zeros and negative readings are not clipped. Unit names are the exact source DUIDs; no classification is guessed from them.
fig, ax = plt.subplots(figsize=(9, 4.5), layout="constrained")
for unit_id, observations in generation.groupby("unit_id"):
    ax.plot(observations["timestamp"], observations["value"], label=unit_id, linewidth=1.6)
ax.set(
    xlabel="Published dispatch label (UTC)",
    ylabel="Instantaneous SCADA output (MW)",
    title="AEMO: real SCADA snapshots, 27 October 2026 NEM day",
)
ax.xaxis.set_major_locator(mdates.HourLocator(interval=4))
ax.xaxis.set_major_formatter(mdates.DateFormatter("%d %b\n%H:%M"))
ax.grid(alpha=0.2)
ax.legend(title="AEMO unit ID")
plt.show()
4. Inspect coverage before doing an energy calculation#
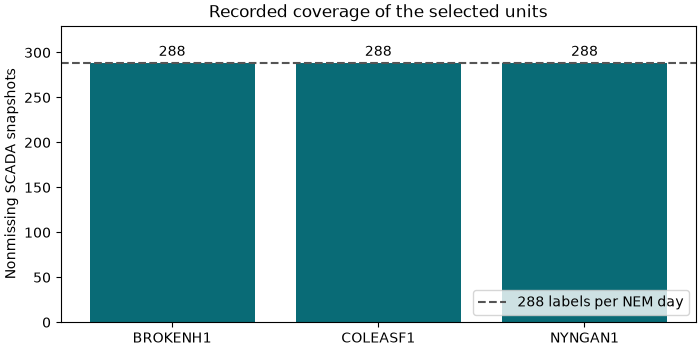
This captured day has all 288 published labels for each selected DUID. That observation does not establish coverage of every AEMO unit. Multiplying snapshots by five minutes would produce an approximation, not metered energy.
counts = generation.groupby("unit_id")["value"].count()
fig, ax = plt.subplots(figsize=(7, 3.5), layout="constrained")
bars = ax.bar(counts.index, counts.to_numpy(), color="#096b76")
ax.axhline(288, color="#555555", linestyle="--", label="288 labels per NEM day")
ax.bar_label(bars, padding=3)
ax.set(
    ylabel="Nonmissing SCADA snapshots",
    title="Recorded coverage of the selected units",
    ylim=(0, 330),
)
ax.legend(loc="lower right")
plt.show()
5. Fetch another available day or discover recent files#
Run this code explicitly when network access is wanted. Daily archive retention is finite, so first inspect the available dates. No credentials are needed. The returned request record includes the upstream archive hash.
from datetime import date
from energy_data_retrieval.sources.aemo import AEMO_HOSTS, AEMOClient
from energy_data_retrieval.transport import HTTPClient

with HTTPClient(AEMO_HOSTS) as http:
    source = AEMOClient(http)
    available = source.list_files(archive=True)
    print(available.urls[-3:])
    result = source.generation_day(
        date(2026, 10, 27), duids=["BROKENH1", "COLEASF1", "NYNGAN1"]
    )
    print(result.frame.head())
    print(result.request)
Use list_files() to discover current interval ZIPs and
fetch_file(available.urls[-1]) to retrieve one listed file. Unavailable
dates and malformed files fail explicitly instead of generating substitute
measurements.
Total running time of the script: (0 minutes 0.181 seconds)