Note
Go to the end to download the full example code.
Database statistics: size, schema and missing metadata#
Measure the actual Parquet files, rather than hard-coding launch counts. Non-null coverage is not accuracy: the shared wide schema deliberately contains fields that do not apply to every entity. Zero and false are reported values; unknown values remain null. Run from a repository checkout, without API access.
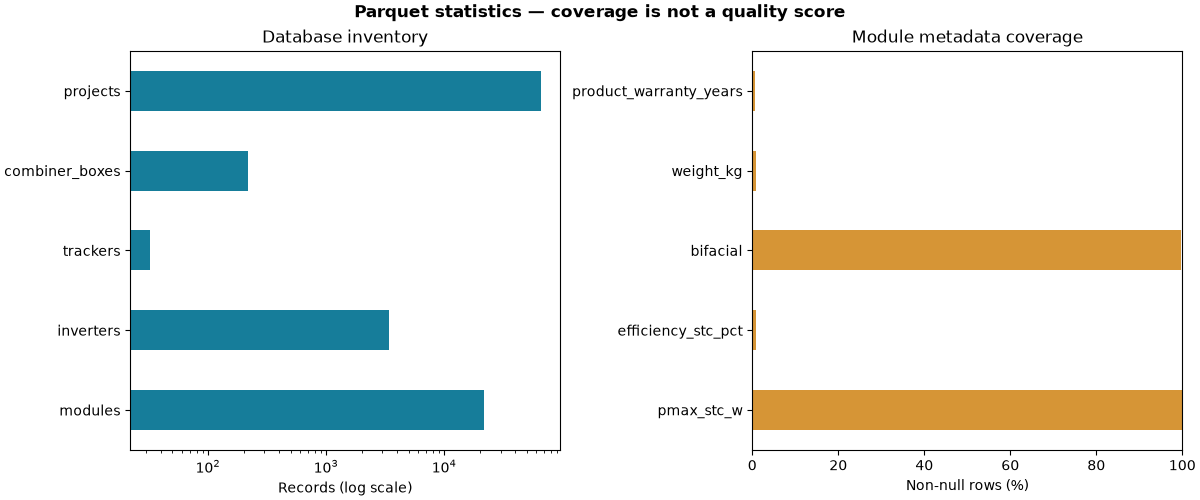
Snapshot statistics (actual files):
                 rows  columns  parquet_bytes
table
modules         21783      148        2500608
inverters        3420      148         686723
trackers           32      148          97242
combiner_boxes    220      148         138590
projects        65439      148       15859100
Project field coverage, including missing values:
                  type    unit  known  missing  coverage_pct
field
country_code    string          65439        0    100.000000
capacity_ac_mw  double      MW  23454    41985     35.841012
capacity_dc_mw  double      MW  25426    40013     38.854506
latitude        double  degree  62834     2605     96.019193
from pathlib import Path
from tempfile import TemporaryDirectory

import matplotlib.pyplot as plt

from energy_analysis.pv_database import field_profile, snapshot_overview
from energy_data_retrieval.pv_catalogue import build_parquet

ROOT = next(p for p in (Path.cwd(), *Path.cwd().parents) if (p / "catalogues/pv").is_dir())
with TemporaryDirectory() as folder:
    snapshot = Path(folder) / "snapshot"
    build_parquet(ROOT / "catalogues/pv", snapshot)
    overview = snapshot_overview(snapshot)
    module_fields = field_profile(snapshot / "modules.parquet")
    project_fields = field_profile(snapshot / "projects.parquet")

print("Snapshot statistics (actual files):")
print(overview.to_string())
print("Project field coverage, including missing values:")
print(project_fields.loc[["country_code", "capacity_ac_mw", "capacity_dc_mw", "latitude"]])

fig, axes = plt.subplots(1, 2, figsize=(12, 5), layout="constrained")
overview["rows"].plot.barh(ax=axes[0], color="#167d9a", logx=True)
axes[0].set(xlabel="Records (log scale)", ylabel="", title="Database inventory")
fields = ["pmax_stc_w", "efficiency_stc_pct", "bifacial", "weight_kg", "product_warranty_years"]
module_fields.loc[fields, "coverage_pct"].plot.barh(ax=axes[1], color="#d69536")
axes[1].set(xlim=(0, 100), xlabel="Non-null rows (%)", ylabel="", title="Module metadata coverage")
fig.suptitle("Parquet statistics — coverage is not a quality score", fontweight="bold")
plt.show()
Total running time of the script: (0 minutes 11.708 seconds)