Note
Go to the end to download the full example code.
Ontario: a full day of actual solar-generator output#
Read 72 actual hourly observations, three Ontario solar facilities across
24 hours, from an IESO Generator Output and Capability report. The source XML
also contains forecasts and capability; the connector selects only actual
Outputs/Output/EnergyMW measurements.
Source: IESO report documentation.
Download the captured XML and
capture manifest.
All observations in this example were captured from the public source.
import hashlib
import json
from pathlib import Path

import matplotlib.pyplot as plt

from energy_data_retrieval.sources.ieso import parse_generation_xml
1. Load the attributed native report selection#
The manifest records the full report hash and the selected three Generator elements. XML was reserialized without changing measurement values. For a live acquisition of a report still in IESO’s recent archive:
from datetime import date
from energy_data_retrieval.sources.ieso import IESO_HOSTS, IESOClient
from energy_data_retrieval.transport import HTTPClient
with HTTPClient(IESO_HOSTS) as http:
    result = IESOClient(http).generation(date(2026, 10, 28), date(2026, 10, 28),
                                         unit_ids=["GRANDSF", "KINGSTONSF"])
The daily XML archive is retained for about 90 days; old report dates can expire. This offline capture remains reproducible after archive expiry.
directory = Path(globals().get("__file__", Path.cwd() / "plot_generation_ieso.py")).resolve().parent
data = directory / "data"
manifest = json.loads((data / "generation_ieso_provenance.json").read_text())
raw = (data / manifest["fixture"]).read_bytes()
if hashlib.sha256(raw).hexdigest() != manifest["fixture_sha256"]:
    raise ValueError("IESO capture differs from its provenance")
frame = parse_generation_xml(raw.decode("utf-8"))
print("Source:", manifest["source_url"])
print("Retrieved:", manifest["retrieved_at_utc"])
Source: https://reports-public.ieso.ca/public/GenOutputCapability/PUB_GenOutputCapability_20261028.xml
Retrieved: 2026-10-30T08:08:29.426273+00:00
2. Convert IESO hour ending with the correct fixed clock#
IESO uses fixed Eastern Standard Time (UTC-05) year round. Hour 1 is
00:00-01:00 EST; Hour 24 is 23:00-24:00 EST. timestamp becomes the UTC
interval start. The values are hourly mean operational MW, not settlement MWh.
Empty/N/A readings would remain missing; an absent observation is not zero.
print(frame.groupby("unit_id").agg(observations=("value", "size"), reported=("value", "count")))
print("First interval:", frame["timestamp"].min(), "to", frame["interval_end"].min())
                 observations  reported
unit_id
GRANDSF                    24        24
KINGSTONSF                 24        24
NANTICOKE SOLAR            24        24
First interval: 2026-10-28 05:00:00+00:00 to 2026-10-28 06:00:00+00:00
3. Compare the three measured daily profiles#
Participating facilities with maximum capability at least 20 MW are included in this source report. These selected facilities do not represent all Ontario solar, particularly smaller and distributed systems.
fig, ax = plt.subplots(figsize=(9, 4.8), layout="constrained")
for name, profile in frame.groupby("unit_id"):
    ax.plot(profile["timestamp"], profile["value"], marker=".", label=name, linewidth=2)
ax.set(
    title="IESO actual solar output · EST report date 28 October 2026",
    xlabel="Hourly interval start (UTC)",
    ylabel="Hourly mean generation (MW)",
)
ax.grid(alpha=0.2)
ax.legend(fontsize=9)
plt.show()
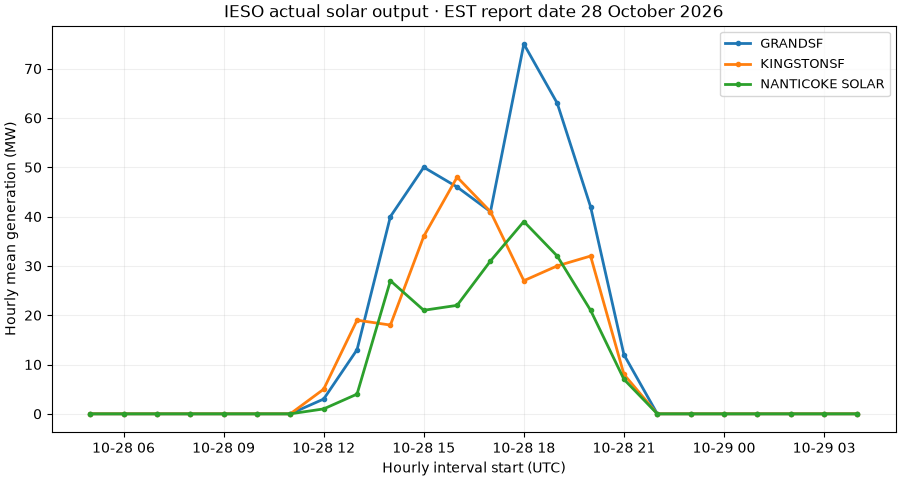
Interpretation#
Capability is an operating limit and forecast is a prediction. Neither is added to actual output. IESO describes the output as operational telemetry; source revisions or telemetry gaps should be considered before using it in a plant-performance study. Credit the Independent Electricity System Operator.
Total running time of the script: (0 minutes 0.111 seconds)