Note
Go to the end to download the full example code.
Solar PV device reliability: evidence and access#
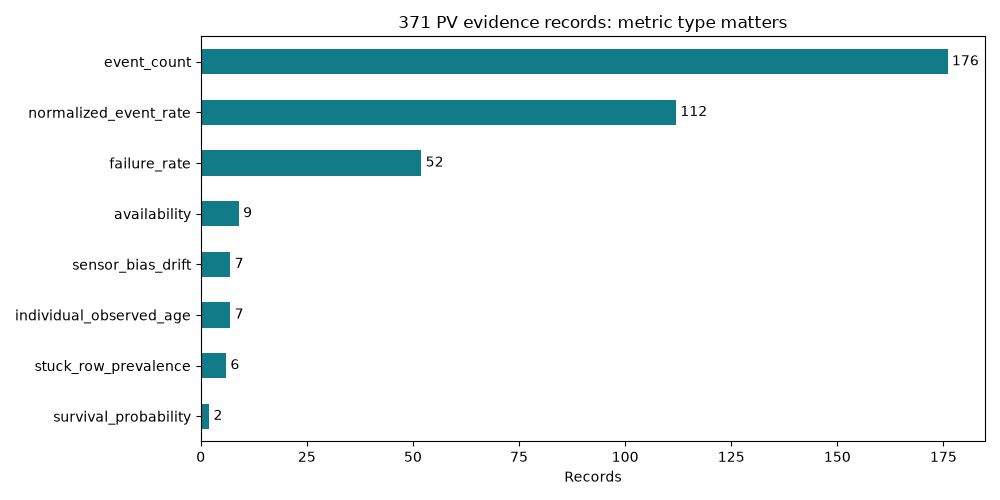
Review 14 sources and load 371 PV-specific records offline. Counts, rates, availability, survival and sensor drift remain separate. Existing Sandia PVROM fits are available through the original failure-database connector.
See the PV reliability research.
        source_id                                                                               access
     baschel_2018                                      Public table; raw juwi O&M records confidential
       lillo_2018                                                  Public tables; 15 plants, 15 months
      bucher_2022                         Public survival summaries; individual histories not provided
     martins_2026                                               Public paper; plant SCADA confidential
        ruth_2018                                                           Public aggregate benchmark
iea_trackers_2024                      Public expert report and owner/operator survey covering 13.4 GW
       brown_2026                                Public observations; raw experimental data on request
      deline_2026                    Public slides and selected PVDAQ series; fleet data NDA-protected
      lindig_2023 Published taxonomy and aggregate research; underlying ticket database not downloaded
    gallardo_2019                    Publisher abstract accessible; institutional full text restricted
      jordan_2020                                                               Public aggregate study
    stanchev_2026                                                    Public single-inverter case study
       pvrom_2018                  Existing packaged connector: energy_data_retrieval.failure_database
       pvrom_2020                             Public report; underlying 800+ system records not public
   source_id                  device                metric              unit
baschel_2018  String monitoring unit          failure_rate  1/operating_hour
  lillo_2018 Junction / combiner box           event_count  events/15_months
  lillo_2018       Monitoring system           event_count  events/15_months
  lillo_2018       Monitoring system normalized_event_rate events/plant_year
   ruth_2018     Single-axis tracker          availability          fraction
martins_2026     Single-axis tracker          availability          fraction
 deline_2026     Single-axis tracker  stuck_row_prevalence          fraction
import matplotlib.pyplot as plt

from energy_data_retrieval.pv_reliability_database import (
    load_pv_reliability_evidence,
    pv_reliability_sources,
)

data = load_pv_reliability_evidence()
print(pv_reliability_sources()[["source_id", "access"]].to_string(index=False))
print(
    data[data.device.str.contains("combiner|monitoring|tracker", case=False)][
        ["source_id", "device", "metric", "unit"]
    ]
    .drop_duplicates()
    .to_string(index=False)
)

counts = data.groupby("metric").size().sort_values()
ax = counts.plot.barh(figsize=(10, 5), color="#117b88")
ax.set(title="371 PV evidence records: metric type matters", xlabel="Records", ylabel="")
for index, count in enumerate(counts):
    ax.text(count + 1, index, str(count), va="center")
plt.tight_layout()
plt.show()
Total running time of the script: (0 minutes 0.089 seconds)