Note
Go to the end to download the full example code.
Automatic PV module counting near Candelaria#
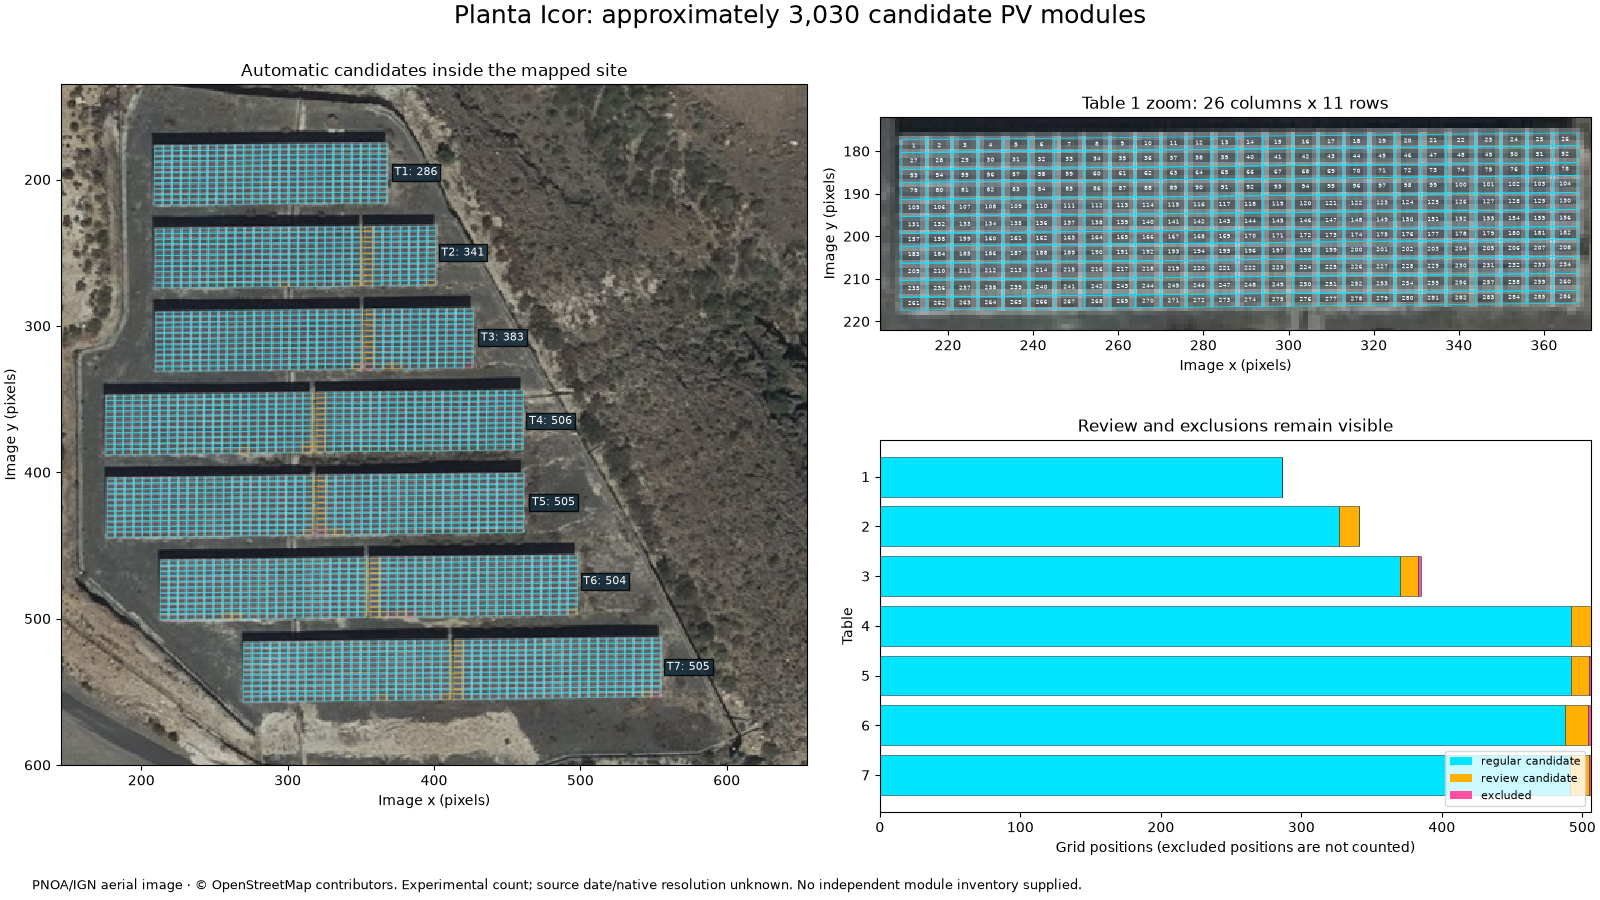
Count module-sized grid candidates in the detailed PNOA/IGN aerial image of Planta Icor, Arico, about 19 km south of Candelaria. The counter automatically finds table outlines and bright frame lines inside the supplied OSM polygon; no table coordinates or row/column counts are entered by hand.
This is an experimental image-based estimate, not a validated plant inventory. The source is aerial orthophotography, not the 10 m Sentinel-2 image, which cannot resolve individual modules. The WMS capture does not establish native optical resolution or acquisition date. The polygon may cover only part of the named 2,000 kW installation, and no capacity is inferred from these counts.
Download the complete offline example.
See the module counting guide.
Python 3.12 or 3.13 is sufficient for the counting step: Orbital PV was used to
capture the attributed input, and no provider access is needed to count it.
import json
from dataclasses import replace
from pathlib import Path

import matplotlib.pyplot as plt
import numpy as np
import pandas as pd
from matplotlib.collections import PolyCollection
from matplotlib.patches import Patch
from pyproj import Geod

from energy_analysis.module_counting import count_rendered_site
from energy_analysis.module_counting.reports import counting_summary
from energy_methods.pv_module_counting import count_regular_pv_modules

HERE = (
    Path(globals().get("__file__", Path.cwd() / "plot_candelaria_module_counting.py"))
    .resolve()
    .parent
)
DATA = HERE / "data"
if not (DATA / "candelaria_site.json").exists():
    DATA = HERE.parent / "connectors/data"
site = json.loads((DATA / "candelaria_site.json").read_text())
study = count_rendered_site(DATA / "candelaria_pnoa.png", site["footprint"])
result = study.result
frame = result.to_frame()
summary = counting_summary(study)
print(
    json.dumps(
        {
            k: summary[k]
            for k in (
                "interpretation",
                "estimated_modules",
                "regular_candidates",
                "review_candidates",
                "excluded_grid_positions",
                "rejected_tables",
            )
        },
        indent=2,
    )
)
{
  "interpretation": "Experimental image-grid estimate, not a validated module inventory",
  "estimated_modules": 3030,
  "regular_candidates": 2946,
  "review_candidates": 84,
  "excluded_grid_positions": 6,
  "rejected_tables": []
}
1. Review the overlay before accepting a count#
Cyan cells have regular spacing and adequate blue/grey pixel support. Amber cells need review (seams or weak colour); magenta cells are excluded by the screening rules. None is a confirmed physical module. Exclusions do not prove missing modules. The zoom uses nearest-neighbour display, with no sharpening.
colours = {"regular_candidate": "#00e5ff", "review_candidate": "#ffb000", "excluded": "#ff4fa0"}
fig = plt.figure(figsize=(16, 9), layout="constrained")
grid = fig.add_gridspec(2, 2, width_ratios=(1.05, 1))
ax_map = fig.add_subplot(grid[:, 0])
ax_zoom = fig.add_subplot(grid[0, 1])
ax_count = fig.add_subplot(grid[1, 1])
for ax in (ax_map, ax_zoom):
    ax.imshow(study.rgb, interpolation="nearest")
    for status, colour in colours.items():
        polygons = [c.vertices_xy for c in result.cells if c.status == status]
        ax.add_collection(
            PolyCollection(
                polygons,
                facecolors="none",
                edgecolors=colour,
                linewidths=0.25 if ax == ax_map else 0.55,
            )
        )
    ax.set(xlabel="Image x (pixels)", ylabel="Image y (pixels)")
for table in result.tables:
    left, top, right, bottom = table.bounds_xyxy
    count = int(((frame.table == table.id) & (frame.status != "excluded")).sum())
    ax_map.text(
        right + 5,
        (top + bottom) / 2,
        f"T{table.id}: {count}",
        fontsize=8,
        color="white",
        bbox={"facecolor": "#122b3a", "alpha": 0.85, "pad": 2},
    )
ax_map.set(xlim=(145, 655), ylim=(600, 135), title="Automatic candidates inside the mapped site")
first = result.tables[0]
left, top, right, bottom = first.bounds_xyxy
ax_zoom.set(
    xlim=(left - 3, right + 3),
    ylim=(bottom + 3, top - 3),
    title=f"Table 1 zoom: {first.columns} columns x {first.rows} rows",
)
for cell in result.cells:
    if cell.table == first.id:
        x, y = np.asarray(cell.vertices_xy).mean(axis=0)
        ax_zoom.text(
            x,
            y,
            str((cell.row - 1) * first.columns + cell.column),
            fontsize=4,
            ha="center",
            va="center",
            color="#f6ffff",
        )
counts = frame.groupby(["table", "status"]).size().unstack(fill_value=0)
left_values = np.zeros(len(counts))
for status, colour in colours.items():
    values = counts.get(status, pd.Series(0, index=counts.index)).to_numpy()
    ax_count.barh(counts.index, values, left=left_values, color=colour, edgecolor="#213547", lw=0.4)
    left_values += values
ax_count.invert_yaxis()
ax_count.set(
    xlabel="Grid positions (excluded positions are not counted)",
    ylabel="Table",
    yticks=counts.index,
    title="Review and exclusions remain visible",
)
ax_count.legend(
    handles=[Patch(facecolor=c, label=s.replace("_", " ")) for s, c in colours.items()],
    fontsize=8,
    loc="lower right",
)
fig.suptitle(
    f"Planta Icor: approximately {result.estimated_modules:,} candidate PV modules", fontsize=18
)
fig.text(
    0.02,
    0.012,
    "PNOA/IGN aerial image · © OpenStreetMap contributors. Experimental count; "
    "source date/native resolution unknown. No independent module inventory supplied.",
    fontsize=9,
)
fig.set_layout_engine("constrained", rect=(0, 0.045, 1, 0.955))
2. Check ground scale and parameter sensitivity#
Image sampling is derived from the WMS viewport, not claimed as native GSD. Ground-projected frame pitches near 1.6 m by 1 m are consistent with modules; ordinary cell-sized features would be smaller than an output pixel here. This plausibility check does not establish module type, power, tilt or count accuracy.
west, south, east, north = study.bounds_wgs84
h, w = study.rgb.shape[:2]
geod = Geod(ellps="WGS84")
mx = geod.inv(west, (south + north) / 2, east, (south + north) / 2)[2] / w
my = geod.inv((west + east) / 2, south, (west + east) / 2, north)[2] / h
print(
    f"Rendered sampling: {mx:.3f} m/pixel east-west, {my:.3f} m/pixel north-south (not native GSD)"
)
pitch_x = np.median([t.column_pitch_pixels for t in result.tables]) * mx
pitch_y = np.median([t.row_pitch_pixels for t in result.tables]) * my
print(f"Median detected ground-projected pitch: {pitch_x:.2f} x {pitch_y:.2f} m")
runs = []
for blue in (0.022, 0.025, 0.028):
    for factor in (0.8, 1.0, 1.2):
        config = replace(
            result.config,
            blue_excess=blue,
            column_prominence=result.config.column_prominence * factor,
            row_prominence=result.config.row_prominence * factor,
        )
        trial = count_regular_pv_modules(study.rgb, study.site_mask, config=config)
        runs.append(
            {
                "blue_threshold": blue,
                "frame_prominence_factor": factor,
                "tables": len(trial.tables),
                "candidates": trial.estimated_modules,
                "review_candidates": trial.review_candidates,
            }
        )
sensitivity = pd.DataFrame(runs)
print(sensitivity.to_string(index=False))
print(
    "Sensitivity range:",
    sensitivity.candidates.min(),
    "to",
    sensitivity.candidates.max(),
    "— parameter variation only; NOT a confidence interval or validation accuracy.",
)
Rendered sampling: 0.268 m/pixel east-west, 0.260 m/pixel north-south (not native GSD)
Median detected ground-projected pitch: 1.61 x 1.04 m
 blue_threshold  frame_prominence_factor  tables  candidates  review_candidates
          0.022                      0.8       7        3032                 77
          0.022                      1.0       7        3032                 77
          0.022                      1.2       7        3032                 77
          0.025                      0.8       7        3030                 84
          0.025                      1.0       7        3030                 84
          0.025                      1.2       7        3030                 84
          0.028                      0.8       7        3030                 84
          0.028                      1.0       7        3030                 84
          0.028                      1.2       7        3030                 84
Sensitivity range: 3030 to 3032 — parameter variation only; NOT a confidence interval or validation accuracy.
3. Export and validate before operational use#
The reusable workflow can export all candidate IDs, polygons, exclusions, parameters, input checksum and software versions. Run this explicitly to save:
from energy_analysis.module_counting.reports import export_counting_study
export_counting_study(study, "/tmp/icor-module-count")  # fresh directory
Review amber/magenta positions and compare a manually labelled sample with the source image or an as-built inventory. Independent annotations are needed for precision, recall and a count-error estimate. No percentage accuracy is claimed. This detector is limited to regular, approximately horizontal, blue/grey arrays; it does not generalize automatically to arbitrary roofs, colours or orientations. Do not convert a candidate count into kWp without verified module specifications.
plt.show()
Total running time of the script: (0 minutes 3.013 seconds)