Note
Go to the end to download the full example code.
ENTSO-E: actual European generation by technology and unit#
This example prepares requests for real ENTSO-E Transparency Platform generation data. The default gallery build is an offline request plan, not measured or simulated power. It downloads no data and needs no credentials.
To retrieve and plot actual observations, first obtain API access through
ENTSO-E’s token instructions,
set ENTSOE_API_TOKEN locally, and run:
ENERGY_DATA_INSIGHTS_LIVE=1 uv run --no-sync python examples/connectors/plot_generation_entsoe.py
The endpoint returns interval-average net power in MW. Some aggregated values may be estimated by the reporting provider. Generation and consumption are separate flows; neither should be summed blindly into a generation total.
1. Select an explicit area and a timezone-aware interval#
Spain’s EIC below is taken from the official area list. The end boundary is exclusive. For a civil day, construct the boundaries in the local timezone before passing them to the connector.
import os
from datetime import UTC, datetime

import matplotlib.pyplot as plt

from energy_data_retrieval.sources.entsoe import ENTSOE_HOSTS, ENTSOEClient, generation_requests
from energy_data_retrieval.transport import HTTPClient

area = "10YES-REE------0"
start = datetime(2025, 9, 1, tzinfo=UTC)
end = datetime(2025, 9, 8, tzinfo=UTC)
2. Inspect the exact public request parameters#
A75 / A16 selects actual generation by production type. A73 / A16 selects actual generation by unit, with conservative daily chunks. Units available under A73 are not a complete inventory of small power plants.
by_type = generation_requests(area, start, end)
by_unit = generation_requests(area, start, end, per_unit=True)
print("Generation by production type:", by_type[0])
print("Per-unit request count:", len(by_unit))
Generation by production type: {'documentType': 'A75', 'processType': 'A16', 'in_Domain': '10YES-REE------0', 'periodStart': '202509010000', 'periodEnd': '202509080000'}
Per-unit request count: 7
3. Fetch and visualize actual generation only when explicitly enabled#
The live branch reads the token from the environment. Each request records a non-secret endpoint, parameters, retrieval time and response hash. The parser expands A03 constant blocks at the published resolution, including explicit missing blocks; it does not forward-fill across Period boundaries.
live = os.environ.get("ENERGY_DATA_INSIGHTS_LIVE") == "1"
if live:
    with HTTPClient(ENTSOE_HOSTS) as http:
        result = ENTSOEClient.from_environment(http).generation_by_type(area, start, end)
    observations = result.data.loc[result.data["flow"].eq("generation")].copy()
    if observations.empty:
        raise RuntimeError("ENTSO-E returned no generation observations for the selected interval")
    selected = observations.loc[observations["technology"].isin(["B16", "B18", "B19"])]
    if selected.empty:
        raise RuntimeError("ENTSO-E returned no solar or wind observations for this query")
    wide = selected.pivot(index="timestamp", columns="technology_name", values="value")
    fig, ax = plt.subplots(figsize=(10, 4), layout="constrained")
    wide.plot(ax=ax, linewidth=1.2)
    ax.set(
        title="Spain: ENTSO-E reported actual solar and wind generation", ylabel="MW", xlabel="UTC"
    )
    ax.legend(title="Production type")
    print(
        f"Retrieved {len(observations):,} generation intervals in {len(result.requests)} requests."
    )
    print("Missing generation values:", int(observations["value"].isna().sum()))
else:
    fig, ax = plt.subplots(figsize=(8, 4), layout="constrained")
    bars = ax.barh(
        ["By production type (A75)", "By generation unit (A73)"],
        [len(by_type), len(by_unit)],
        color=["#096b76", "#d68b2a"],
    )
    ax.bar_label(bars, padding=4)
    ax.set(
        title="ENTSO-E: offline plan for 1-8 September 2025",
        xlabel="Planned API requests — no measurements downloaded",
        xlim=(0, 8.5),
        xticks=range(9),
    )
    print(
        "Offline request plan only. Enable ENERGY_DATA_INSIGHTS_LIVE=1 for real generation plots."
    )
plt.show()
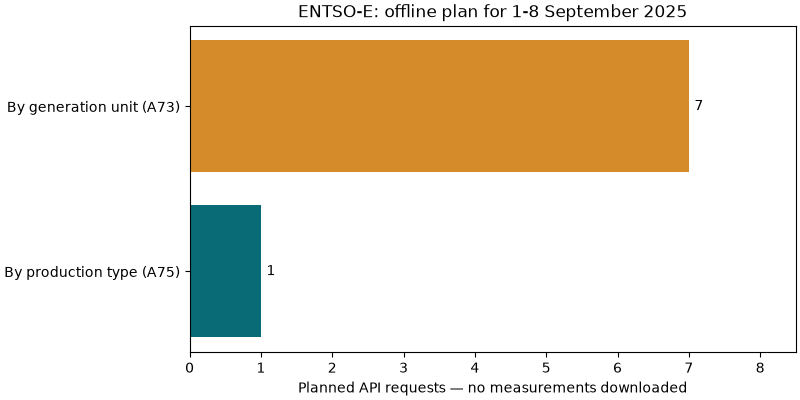
Offline request plan only. Enable ENERGY_DATA_INSIGHTS_LIVE=1 for real generation plots.
4. Retrieve individual generation units using the same connector#
In a live session the corresponding call is:
units = ENTSOEClient.from_environment(http).generation_by_unit(
    area, start, end, psr_type="B16"
)
unit_id optionally selects one published resource EIC. The output retains
the unit EIC, production type, generation/consumption flow, document revision,
interval start/end and duration. To convert a complete native interval to
energy, multiply its MW by duration_hours; keep missing observations missing.
Total running time of the script: (0 minutes 0.055 seconds)