Note
Go to the end to download the full example code.
Germany: real quarter-hour solar and wind energy#
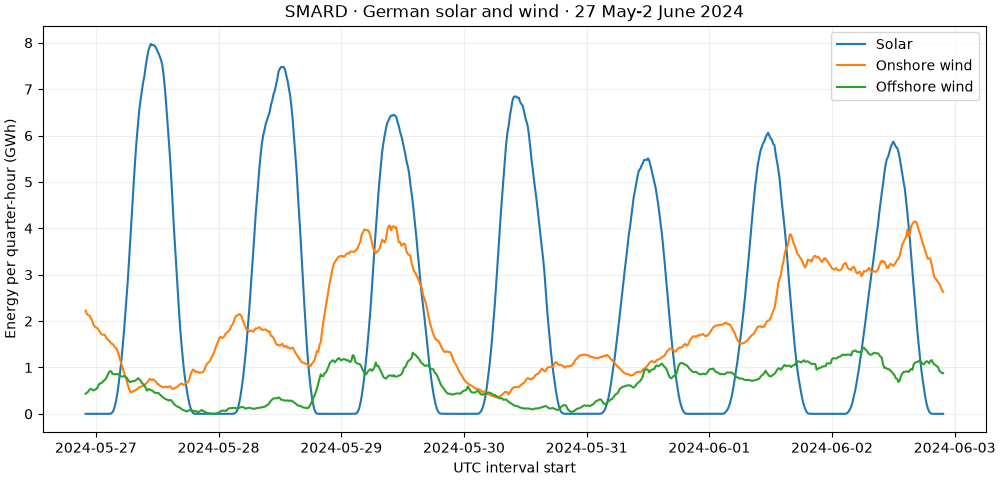
Compare German solar, onshore wind and offshore wind over 27 May-2 June 2024 using three complete SMARD chart responses. Each contains 672 native quarter-hour MWh values. SMARD has already converted the upstream power values to energy; this example does not divide by four again.
Sources: SMARD generation user guide
and data-use terms.
Attribution: Bundesnetzagentur | SMARD.de, CC BY 4.0.
Download solar,
onshore wind,
offshore wind and their
capture manifest.
The example runs entirely offline.
import hashlib
import json
from pathlib import Path

import matplotlib.pyplot as plt
import pandas as pd

from energy_data_retrieval.sources.smard import normalize_generation
1. Verify each unchanged weekly source response#
A fresh bounded acquisition uses inclusive German calendar dates:
from datetime import date
from energy_data_retrieval.sources.smard import SMARD_HOSTS, SMARDClient
from energy_data_retrieval.transport import HTTPClient
with HTTPClient(SMARD_HOSTS) as http:
    result = SMARDClient(http).generation(date(2024, 5, 27), date(2024, 6, 2))
The client reads each series index to discover actual week boundaries rather than assuming every local week has 168 hours across daylight-saving changes.
directory = (
    Path(globals().get("__file__", Path.cwd() / "plot_generation_smard.py")).resolve().parent
)
data = directory / "data"
manifest = json.loads((data / "generation_smard_provenance.json").read_text())
frames = []
for capture in manifest["files"]:
    raw = (data / capture["file"]).read_bytes()
    if hashlib.sha256(raw).hexdigest() != capture["sha256"]:
        raise ValueError("SMARD capture differs from its provenance")
    technology = capture["file"].removeprefix("generation_smard_").removesuffix(".json")
    frames.append(normalize_generation(json.loads(raw), technology=technology))
    print(technology, "source:", capture["source_url"], "retrieved:", capture["retrieved_at_utc"])
frame = pd.concat(frames, ignore_index=True)
solar source: https://www.smard.de/app/chart_data/4068/DE/4068_DE_quarterhour_1716760800000.json retrieved: 2026-10-30T08:14:32.724569+00:00
wind_onshore source: https://www.smard.de/app/chart_data/4067/DE/4067_DE_quarterhour_1716760800000.json retrieved: 2026-10-30T08:14:33.171115+00:00
wind_offshore source: https://www.smard.de/app/chart_data/1225/DE/1225_DE_quarterhour_1716760800000.json retrieved: 2026-10-30T08:14:33.295712+00:00
2. Compare interval energy profiles#
These are national net grid-feed observations. Epoch milliseconds identify UTC interval starts even when a local clock hour repeats. Only the plotted unit is scaled from MWh to GWh per quarter-hour.
profiles = frame.pivot(index="timestamp", columns="technology", values="value")
fig, ax = plt.subplots(figsize=(10, 4.8), layout="constrained")
for technology, name in [
    ("solar", "Solar"),
    ("wind_onshore", "Onshore wind"),
    ("wind_offshore", "Offshore wind"),
]:
    ax.plot(profiles.index, profiles[technology] / 1000, label=name, linewidth=1.5)
ax.set(
    xlabel="UTC interval start",
    ylabel="Energy per quarter-hour (GWh)",
    title="SMARD · German solar and wind · 27 May-2 June 2024",
)
ax.grid(alpha=0.2)
ax.legend()
plt.show()
3. Sum only the selected technologies’ reported interval energy#
A sum of interval MWh is energy. The counts remain visible alongside the sums; missing records would prevent calling the result a complete weekly total. These three technologies are not the whole German energy mix.
summary = frame.groupby("technology").agg(
    reported_mwh=("value", lambda values: values.sum(min_count=1)),
    reported_intervals=("value", "count"),
)
print(summary)
fig, ax = plt.subplots(figsize=(8, 4), layout="constrained")
bars = ax.barh(summary.index, summary.reported_mwh / 1000, color="#397b91")
ax.bar_label(bars, fmt="%.1f", padding=3)
ax.set(
    xlabel="Sum of reported interval energy (GWh)",
    title="Selected technologies only · 672 quarters each",
)
ax.grid(axis="x", alpha=0.2)
plt.show()
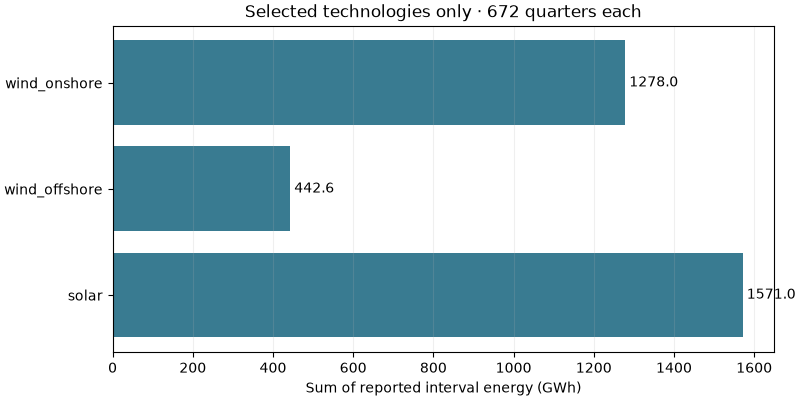
               reported_mwh  reported_intervals
technology
solar            1570993.75                 672
wind_offshore     442639.50                 672
wind_onshore     1278028.75                 672
Scope#
SMARD’s upstream source is ENTSO-E, so agreement between those two connectors is not an independent measurement validation. Behind-the-meter self-consumption is outside the published grid-feed totals. The source metadata and captured response hashes preserve which revision was used.
Total running time of the script: (0 minutes 0.206 seconds)