Note
Go to the end to download the full example code.
Solar PV reliability: inverter, tracker, WST and combiner analysis#
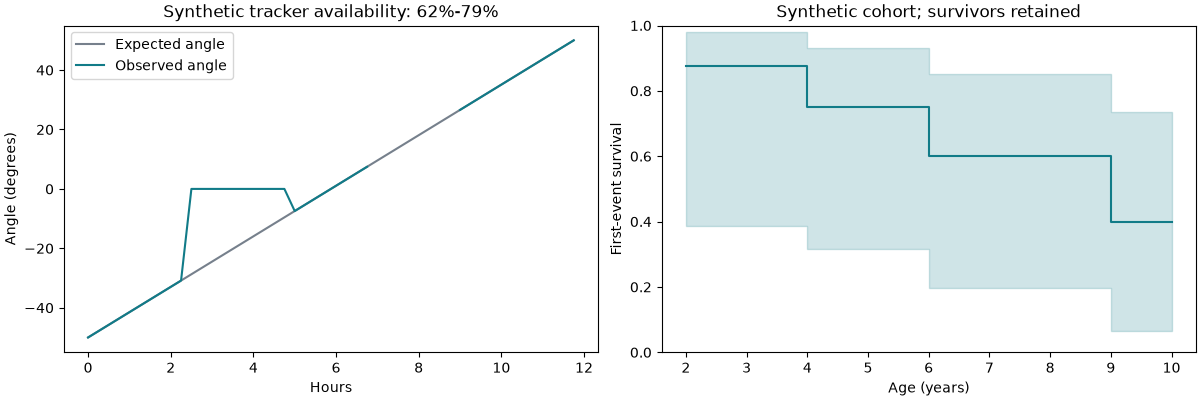
Analyse published evidence without mixing failure rates, time availability, survival and individual instrument ages. An illustrative combiner bill of materials turns attributed part rates into a component-event planning scenario.
See the research and limitations.
Unflagged component-rate alternatives: 47
                device  parts_per_box  events_per_box_year
           String fuse             24             0.006071
          Terminal lug             48             0.000193
String monitoring unit              1             0.006625
             DC switch              1             0.000803
Illustrative CBX case: {'assembly_event_rate_per_operating_hour': 3.41e-06, 'expected_events_per_year': 0.01369115, 'probability_at_least_one_event': 0.013597852474655002, 'boxes': 500, 'fleet_expected_component_events_per_year': 6.845574999999999}
These are component events, not complete box outages or predicted replacements.
import matplotlib.pyplot as plt

from energy_analysis.pv_device_reliability import (
    combiner_box_case,
    plot_pv_reliability_evidence,
    published_rate_scenarios,
)

print("Unflagged component-rate alternatives:", len(published_rate_scenarios()))
parts, scenario = combiner_box_case(boxes=500)
print(parts[["device", "parts_per_box", "events_per_box_year"]].to_string(index=False))
print("Illustrative CBX case:", scenario)
print("These are component events, not complete box outages or predicted replacements.")
figure = plot_pv_reliability_evidence()
plt.show()
Total running time of the script: (0 minutes 0.416 seconds)