Note
Go to the end to download the full example code.
Climate-change yield assessment#
Separate irradiance, temperature and degradation effects over 50 years. All weather and DC yields below are synthetic. The chosen trajectory is an illustration, not an SSP projection or a reproduction of the Bolzano measurements. See the CCYA method guide for its thesis mapping.
import matplotlib.pyplot as plt
import numpy as np
import pandas as pd

from energy_methods.ccya import fit_ccya
Calibrate on ten complete historical years, preserving native month lengths.
index = pd.period_range("2010-01", periods=120, freq="M")
season = np.sin(2 * np.pi * (index.month.to_numpy() - 3) / 12)
historical = pd.DataFrame(
    {"ghi_wm2": 150 + 90 * season, "temperature_c": 12 + 9 * season, "days": index.days_in_month},
    index=index,
)
measured = historical.copy()
measured["ghi_wm2"] = historical["ghi_wm2"] * 1.1 + 5
measured["temperature_c"] += 2
measured["dc_yield_kwh_kwp"] = measured["ghi_wm2"] * 24 / 1000 * 0.85 * measured["days"]
model = fit_ccya(measured, historical)
Increase GHI by 10% and air temperature by 2 °C across the illustrative horizon.
future_index = pd.period_range("2020-01", periods=600, freq="M")
season = np.sin(2 * np.pi * (future_index.month.to_numpy() - 3) / 12)
progress = np.repeat(np.arange(50) / 49, 12)
future = pd.DataFrame(
    {
        "ghi_wm2": (150 + 90 * season) * (1 + 0.1 * progress),
        "temperature_c": 12 + 9 * season + 2 * progress,
        "days": future_index.days_in_month,
    },
    index=future_index,
)
result = model.project(future, scenario="synthetic_brightening", degradation_per_year=0.005)
annual = result.annual
Each line includes the stated combination of effects. Annual energy sums use the actual number of days in each synthetic calendar year.
fig, ax = plt.subplots(figsize=(8, 4.5), layout="constrained")
for component, label in (
    ("irradiance", "Irradiance"),
    ("irradiance_temperature", "Irradiance + temperature"),
    ("combined", "Irradiance + temperature + degradation"),
):
    ax.plot(annual["operating_year"], annual[f"{component}_kwh_kwp"], label=label)
ax.set(
    xlabel="Operating year",
    ylabel="Annual DC yield (kWh/kWp)",
    title="Synthetic CCYA: +10% GHI, +2 °C, 0.5%/year degradation",
)
ax.grid(alpha=0.2)
ax.legend(fontsize=9)
plt.show()

print(annual.loc[[2044, 2069], ["operating_year", "combined_cumulative_gain_p50_pct"]])
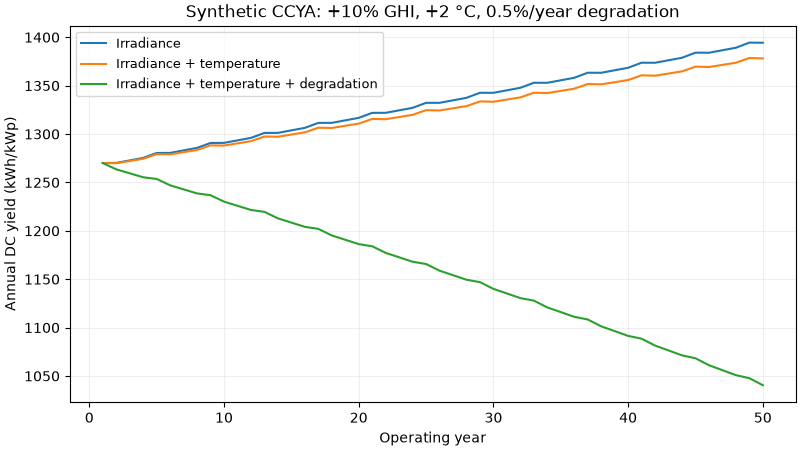
      operating_year  combined_cumulative_gain_p50_pct
year
2044              25                         -3.968863
2069              50                         -8.545843
Total running time of the script: (0 minutes 0.141 seconds)