Note
Go to the end to download the full example code.
France: real half-hour generation from RTE#
Parse France’s national generation mix on 1 June 2024 from RTE’s ODRÉ éCO2mix consolidated/definitive dataset. The real response includes 96 records: 48 half-hour actual-generation records and 48 intervening forecast-only rows. Generation is reported in MW, not MWh. The gallery runs offline.
Source: RTE/ODRÉ consolidated éCO2mix,
Etalab Open Licence v2. Download the
native response and
capture manifest.
import hashlib
import json
from pathlib import Path

import matplotlib.pyplot as plt

from energy_data_retrieval.sources.rte import normalize_generation
1. Verify the unchanged response and its source URL#
To acquire a new French civil day, outside this offline example:
from datetime import date
from energy_data_retrieval.sources.rte import RTE_HOSTS, RTEClient
from energy_data_retrieval.transport import HTTPClient
with HTTPClient(RTE_HOSTS) as http:
    result = RTEClient(http).generation(date(2024, 6, 1), date(2024, 6, 1))
directory = Path(globals().get("__file__", Path.cwd() / "plot_generation_rte.py")).resolve().parent
data = directory / "data"
manifest = json.loads((data / "generation_rte_provenance.json").read_text())
capture = manifest["files"][0]
raw = (data / capture["file"]).read_bytes()
if hashlib.sha256(raw).hexdigest() != capture["sha256"]:
    raise ValueError("RTE capture differs from its provenance")
print("Source:", capture["source_url"])
print("Retrieved:", capture["retrieved_at_utc"])
Source: https://odre.opendatasoft.com/api/explore/v2.1/catalog/datasets/eco2mix-national-cons-def/records?where=date_heure+%3E%3D+date%272024-05-31T22%3A00%3A00%2B00%3A00%27+and+date_heure+%3C+date%272024-06-01T22%3A00%3A00%2B00%3A00%27&order_by=date_heure&limit=100&offset=0
Retrieved: 2026-10-30T08:14:32.569581+00:00
2. Separate actual generation from forecast-only timestamps#
Empty generation columns at minutes 15 and 45 do not mean zero output. They belong to quarter-hour consumption-forecast records. Genuine half-hour nulls stay missing, and the eight top-level technologies do not include their own detailed subcategories a second time. Pumping and imports are separate source quantities and are not treated as electricity generation here.
frame = normalize_generation(json.loads(raw))
print("Excluded forecast-only source rows:", frame.attrs["excluded_forecast_only_rows"])
print("Actual half-hour timestamps:", frame.timestamp.nunique())
print("Quality states:", frame.nature.unique())
profiles = frame.pivot(index="timestamp", columns="technology", values="value")
Excluded forecast-only source rows: 48
Actual half-hour timestamps: 48
Quality states: ['Données définitives']
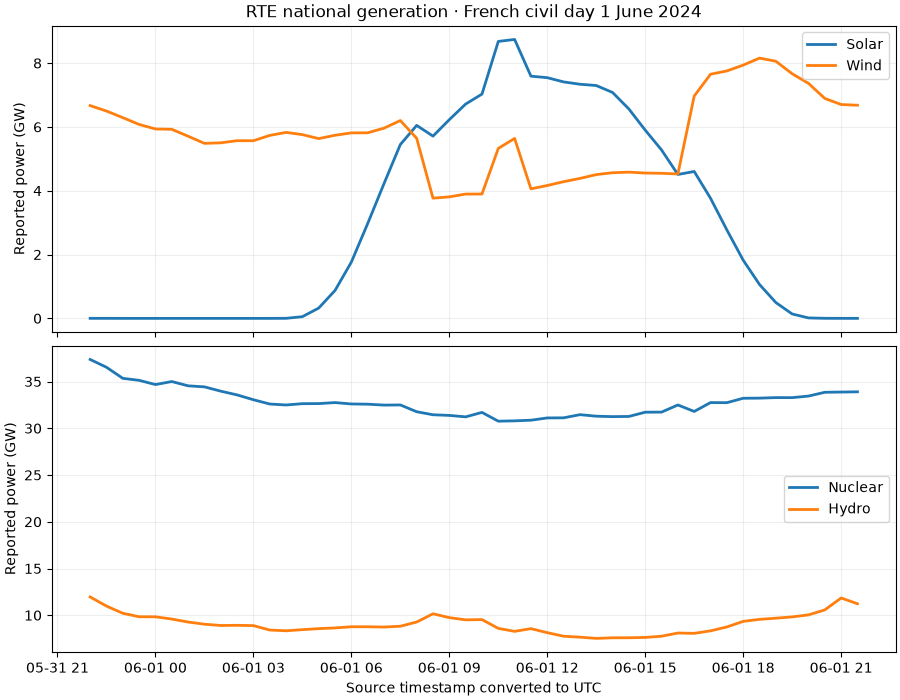
3. Compare reported technology profiles#
The display converts MW to GW only. It does not sum power values and call the result energy. The horizontal axis uses UTC; the selected source day is local to France and begins at 22:00 UTC on the preceding date in summer.
fig, axes = plt.subplots(2, 1, figsize=(9, 7), sharex=True, layout="constrained")
for technology, name in [("solaire", "Solar"), ("eolien", "Wind")]:
    axes[0].plot(profiles.index, profiles[technology] / 1000, label=name, linewidth=2)
for technology, name in [("nucleaire", "Nuclear"), ("hydraulique", "Hydro")]:
    axes[1].plot(profiles.index, profiles[technology] / 1000, label=name, linewidth=2)
for ax in axes:
    ax.set(ylabel="Reported power (GW)")
    ax.grid(alpha=0.2)
    ax.legend()
axes[0].set_title("RTE national generation · French civil day 1 June 2024")
axes[1].set_xlabel("Source timestamp converted to UTC")
plt.show()
Scope and quality#
These are system-level observations prepared from metering and completed by provider conventions, not individual plant SCADA. A consolidated value can be revised before becoming definitive; the source quality state and retrieval hash identify the publication used in this example.
Total running time of the script: (0 minutes 0.158 seconds)