Note
Go to the end to download the full example code.
PV degradation uncertainty and lifetime#
Recalculate four lifetime curves from published coefficients, inspect climate input differences, and run explicit sensitivity scenarios from Kaaya et al. (2021), DOI 10.1016/j.solener.2021.01.071. This example runs offline from the packaged numerical tables; the original field time series are unavailable.
The guide explains the printed thermal equation, incomplete calibration constants, units, and source table inconsistencies. Scenario results are not reproductions of paper figures.
import matplotlib.pyplot as plt
import numpy as np

from energy_analysis.degradation_uncertainty.study import (
    climate_input_comparisons,
    climate_sensitivity,
    physical_model_scenario,
    published_tables,
    reliability_table_check,
    synthetic_weather_benchmark,
)
from energy_methods.pv_reliability import ReliabilityCurve
Published coefficients: four different extrapolations#
No refit or reconstruction of original observations is claimed. The stretched exponential coefficient is in year**(-beta), not a common percent/year rate. The threshold is 80% retained power, not a survival probability.
print(reliability_table_check().to_string(index=False))
age = np.linspace(0, 50, 501)
fig, ax = plt.subplots(figsize=(8.5, 5), layout="constrained")
for row in published_tables()["reliability_table3"]:
    curve = ReliabilityCurve(**{k: v for k, v in row.items() if k != "reported_failure_years"})
    ax.plot(age, curve.power(age), label=curve.kind.replace("_", " "))
ax.axhline(0.8, color="black", linestyle="--", label="80% retained power")
ax.axvspan(0, 8.1, alpha=0.08, color="black", label="Paper's observation duration")
ax.set(
    xlabel="Age (years)",
    ylabel="Normalized power",
    ylim=(0, 1.02),
    title="Published Table 3 coefficients: model-dependent extrapolation",
)
ax.legend(fontsize=9)
plt.show()
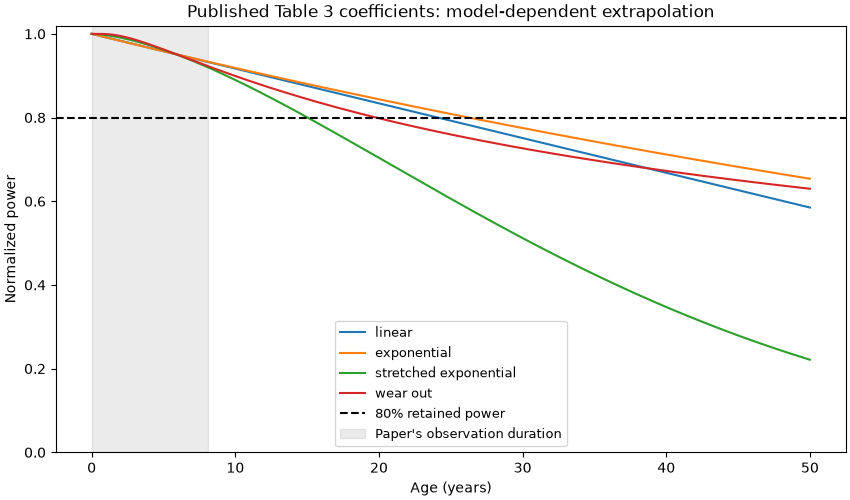
                 kind      k  reported_failure_years coefficient_units  calculated_failure_years  calculated_minus_reported_years                                        evidence  beta  gamma   mu
               linear 0.0083                    24.0        year**(-1)                 24.096386                         0.096386 rounded published parameters, Table 3; no refit   NaN    NaN  NaN
          exponential 0.0085                    26.2        year**(-1)                 26.252183                         0.052183 rounded published parameters, Table 3; no refit   NaN    NaN  NaN
stretched_exponential 0.0030                    15.1     year**(-beta)                 15.032140                        -0.067860 rounded published parameters, Table 3; no refit  1.59    NaN  NaN
             wear_out 0.0087                    19.7        year**(-1)                 19.792414                         0.092414 rounded published parameters, Table 3; no refit   NaN   0.43 0.52
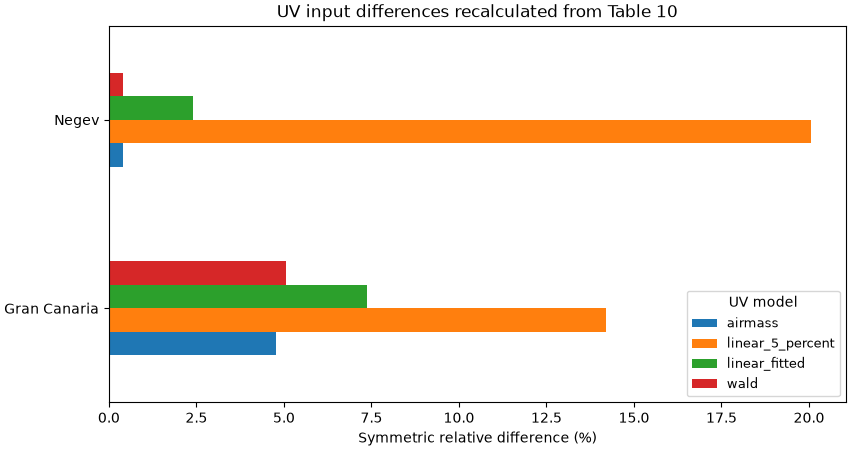
Recompute input differences without inventing hourly records#
Eq. 20 normalizes by the larger absolute value. Negev’s UV reference differs between Tables 6 and 10; each comparison preserves its source table. Published rounded differences are not used to overwrite the equation’s calculated value.
inputs = climate_input_comparisons()
uv = inputs[inputs.variable == "uv_kwh_m2"]
fig, ax = plt.subplots(figsize=(8.5, 4.5), layout="constrained")
uv.pivot(index="site", columns="model", values="relative_difference_percent").plot.barh(ax=ax)
ax.set(
    xlabel="Symmetric relative difference (%)",
    ylabel="",
    title="UV input differences recalculated from Table 10",
)
ax.legend(title="UV model", fontsize=9)
plt.show()
Propagate climate substitutions under declared assumptions#
Table 5 omits normalization and cycling frequency. This explicit scenario chooses A_N=1, 365 cycles/year and numerical percent/year conversion. It retains the printed 273+delta-T term. It is not a field-validated lifetime prediction.
scenario = climate_sensitivity(
    normalization=1.0, cycles_per_year=365.0, rate_scale_to_year_inverse=0.01
)
temperature = scenario[scenario.driver == "temperature"]
fig, ax = plt.subplots(figsize=(8.5, 5), layout="constrained")
temperature.pivot(
    index="site", columns="model", values="rate_relative_difference_percent"
).plot.barh(ax=ax)
ax.set(
    xlabel="Symmetric rate difference (%)",
    ylabel="",
    title="Temperature sensitivity: UNVALIDATED parameter scenario",
)
plt.show()
print(scenario.to_string(index=False))
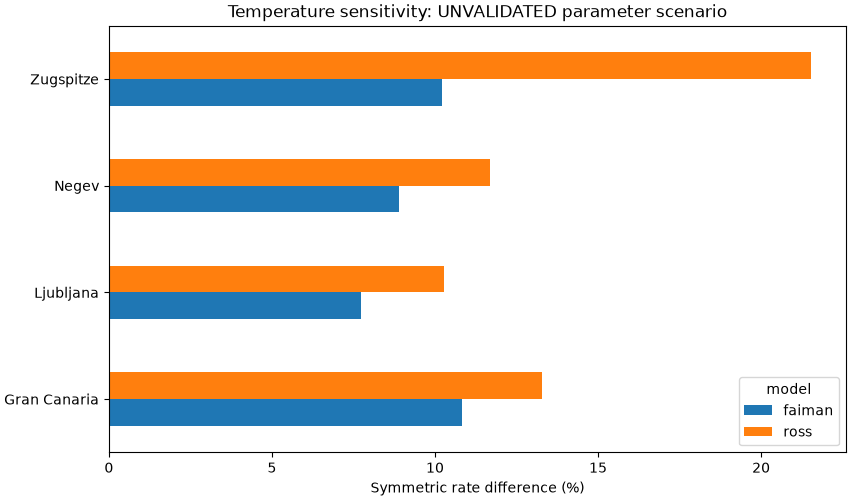
        site      driver            model  source_table  reference_rate_fraction_per_year  rate_fraction_per_year  rate_relative_difference_percent  reference_failure_years  failure_years  lifetime_relative_difference_percent                                                 evidence
       Negev temperature           faiman             8                          0.025762                0.023474                          8.881283                 9.534233      10.463528                              8.881283 unvalidated scenario; A_N, cycles and unit scale assumed
       Negev temperature             ross             8                          0.025762                0.022753                         11.678480                 9.534233      10.794915                             11.678480 unvalidated scenario; A_N, cycles and unit scale assumed
Gran Canaria temperature           faiman             8                          0.011039                0.012381                         10.840718                22.251337      19.839132                             10.840718 unvalidated scenario; A_N, cycles and unit scale assumed
Gran Canaria temperature             ross             8                          0.011039                0.009573                         13.277296                22.251337      25.658029                             13.277296 unvalidated scenario; A_N, cycles and unit scale assumed
   Zugspitze temperature           faiman             8                          0.013081                0.011745                         10.209045                18.777652      20.912632                             10.209045 unvalidated scenario; A_N, cycles and unit scale assumed
   Zugspitze temperature             ross             8                          0.013081                0.010265                         21.521838                18.777652      23.927232                             21.521838 unvalidated scenario; A_N, cycles and unit scale assumed
   Ljubljana temperature           faiman             8                          0.021910                0.023742                          7.716930                11.210661      10.345542                              7.716930 unvalidated scenario; A_N, cycles and unit scale assumed
   Ljubljana temperature             ross             8                          0.021910                0.024423                         10.289987                11.210661      10.057085                             10.289987 unvalidated scenario; A_N, cycles and unit scale assumed
       Negev    humidity             buck            11                          0.025762                0.025711                          0.196789                 9.534233       9.553032                              0.196789 unvalidated scenario; A_N, cycles and unit scale assumed
Gran Canaria    humidity             buck            11                          0.011039                0.011053                          0.129108                22.251337      22.222608                              0.129108 unvalidated scenario; A_N, cycles and unit scale assumed
   Zugspitze    humidity             buck            11                          0.013081                0.013082                          0.013186                18.777652      18.775176                              0.013186 unvalidated scenario; A_N, cycles and unit scale assumed
   Ljubljana    humidity             buck            11                          0.021910                0.021924                          0.066814                11.210661      11.203171                              0.066814 unvalidated scenario; A_N, cycles and unit scale assumed
       Negev     UV dose linear_5_percent            10                          0.025762                0.025790                          0.105388                 9.534147       9.524099                              0.105388 unvalidated scenario; A_N, cycles and unit scale assumed
       Negev     UV dose    linear_fitted            10                          0.025762                0.025765                          0.010823                 9.534147       9.533115                              0.010823 unvalidated scenario; A_N, cycles and unit scale assumed
       Negev     UV dose             wald            10                          0.025762                0.025762                          0.001814                 9.534147       9.534319                              0.001814 unvalidated scenario; A_N, cycles and unit scale assumed
       Negev     UV dose          airmass            10                          0.025762                0.025763                          0.001811                 9.534147       9.533974                              0.001811 unvalidated scenario; A_N, cycles and unit scale assumed
Gran Canaria     UV dose linear_5_percent            10                          0.011039                0.011046                          0.064409                22.251337      22.237005                              0.064409 unvalidated scenario; A_N, cycles and unit scale assumed
Gran Canaria     UV dose    linear_fitted            10                          0.011039                0.011042                          0.031478                22.251337      22.244332                              0.031478 unvalidated scenario; A_N, cycles and unit scale assumed
Gran Canaria     UV dose             wald            10                          0.011039                0.011041                          0.021086                22.251337      22.246645                              0.021086 unvalidated scenario; A_N, cycles and unit scale assumed
Gran Canaria     UV dose          airmass            10                          0.011039                0.011041                          0.019881                22.251337      22.246913                              0.019881 unvalidated scenario; A_N, cycles and unit scale assumed
Synthetic checks of weather calibration and physical models#
Fit temperature using synthetic 2023 data and evaluate on synthetic 2024 data. Targets are generated by Faiman/Wald/Buck, so their advantage is by construction. The daily stress-product equation uses daytime irradiance, whereas the combined model uses integrated annual UV dose. Assumed scales prevent a fair ranking.
print(synthetic_weather_benchmark().to_string(index=False))
print(physical_model_scenario().to_string(index=False))
                 variable                model  nrmse_percent                            coefficients
     module_temperature_c                 ross       4.481407    {"coefficient": 0.02417109198907464}
     module_temperature_c               faiman       0.000000                 {"u0": 27.0, "u1": 6.0}
       uv_irradiance_w_m2     linear_5_percent      20.543512 declared synthetic scenario; see source
       uv_irradiance_w_m2                 wald       0.000000 declared synthetic scenario; see source
       uv_irradiance_w_m2 airmass_table9_negev      41.170501 declared synthetic scenario; see source
relative_humidity_percent                 buck       0.000000                                  Eq. 17
                         model  rate_fraction_per_year                                             aggregation                                                           evidence
  daily stress product (Eq. 1)                0.000030                         mean of daily rate coefficients synthetic, unvalidated scales; not a fair calibrated model ranking
combined mechanisms (Eqs. 3-6)                0.016833 evaluate annual daytime stresses and integrated UV dose synthetic, unvalidated scales; not a fair calibrated model ranking
Total running time of the script: (0 minutes 0.273 seconds)