Note
Go to the end to download the full example code.
PVDAQ: measured power from a research PV array#
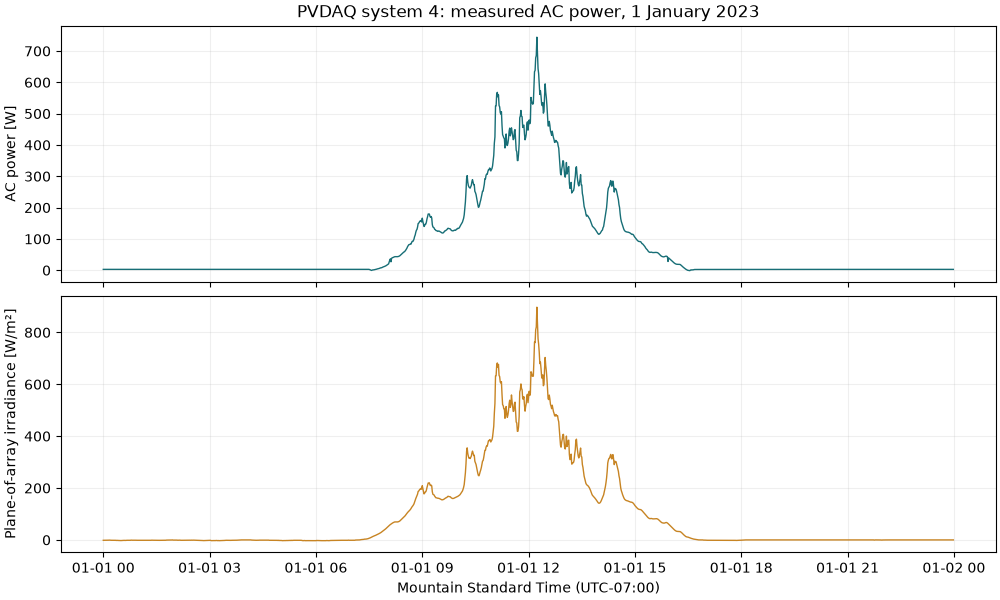
This example reads a complete, real daily CSV for PVDAQ system 4 from the public OEDI archive. The 1,440 one-minute observations for 1 January 2023 include measured AC power and irradiance. This is an individual research array; it is not a regional generation total.
Download the native CSV,
channel metadata and
source/checksum manifest, or
the complete generation example bundle.
The default gallery is offline. Set ENERGY_DATA_INSIGHTS_LIVE=1 to fetch the
same published day anonymously from OEDI.
1. Choose a measured channel and verify its native units#
Column names contain metric IDs. The accompanying provider metadata identifies
ac_power__315 as average AC power in W, with scale 1 and offset 0.
A live metadata lookup is PVDAQClient(http).metrics(4). The CSV’s local
measured_on clock is interpreted explicitly as UTC-07:00 for this winter
date; this does not assume the same clock convention for every PVDAQ system.
import hashlib
import json
import os
from datetime import date
from pathlib import Path

import matplotlib.pyplot as plt

from energy_data_retrieval.sources.pvdaq import PVDAQ_HOSTS, PVDAQClient, parse_generation_csv
from energy_data_retrieval.transport import HTTPClient

example_dir = (
    Path(globals().get("__file__", Path.cwd() / "plot_generation_pvdaq.py")).resolve().parent
)
data_dir = example_dir / "data"
manifest = json.loads((data_dir / "generation_pvdaq_provenance.json").read_text())
metadata = json.loads((data_dir / "generation_pvdaq_metrics.json").read_text())
channel = next(row for row in metadata if row["metric_id"] == 315)
print("Selected channel:", channel["standard_name"], channel["units"], channel["aggregation_type"])
Selected channel: ac_power__315 W avg
2. Parse the capture, or make an explicit bounded live request#
Original columns and signed/missing values are retained. Missing archive files raise an error; the connector does not manufacture a continuous generation history from gaps in the catalogue’s advertised range.
options = {"power_column": "ac_power__315", "unit": "W", "source_timezone": "-07:00"}
if os.environ.get("ENERGY_DATA_INSIGHTS_LIVE") == "1":
    with HTTPClient(PVDAQ_HOSTS) as http:
        result = PVDAQClient(http).generation(4, date(2023, 1, 1), date(2023, 1, 1), **options)
    frame = result.frame
else:
    content = (data_dir / "generation_pvdaq.csv").read_bytes()
    if hashlib.sha256(content).hexdigest() != manifest["sha256"]:
        raise RuntimeError("The captured PVDAQ CSV no longer matches its source manifest")
    frame = parse_generation_csv(content, system_id=4, **options)
print("Measured observations:", len(frame), "Missing AC power:", int(frame.value.isna().sum()))
Measured observations: 1440 Missing AC power: 0
3. Compare the actual daily power and irradiance profiles#
The graph uses the source’s fixed local clock for this day. Nighttime offsets, sensor noise and cloudy periods remain as published; the example performs no clipping, gap filling or performance-ratio inference.
local = frame.timestamp.dt.tz_convert("Etc/GMT+7")
fig, axes = plt.subplots(2, 1, figsize=(10, 6), sharex=True, layout="constrained")
axes[0].plot(local, frame.value, color="#176e76", linewidth=1.0)
axes[0].set(title="PVDAQ system 4: measured AC power, 1 January 2023", ylabel="AC power [W]")
axes[1].plot(local, frame.poa_irradiance__313, color="#c78423", linewidth=1.0)
axes[1].set(ylabel="Plane-of-array irradiance [W/m²]", xlabel="Mountain Standard Time (UTC-07:00)")
for ax in axes:
    ax.grid(alpha=0.2)
plt.show()
4. Use a new snapshot for another site or channel#
Inspect that system’s metadata first. Provide its exact measured power column, verified W/kW/MW unit and timezone. Sampling rates, sensors and record quality vary by site; a column name alone is not a unit specification.
Total running time of the script: (0 minutes 0.165 seconds)