Note
Go to the end to download the full example code.
DKASC: import measured five-minute PV array output#
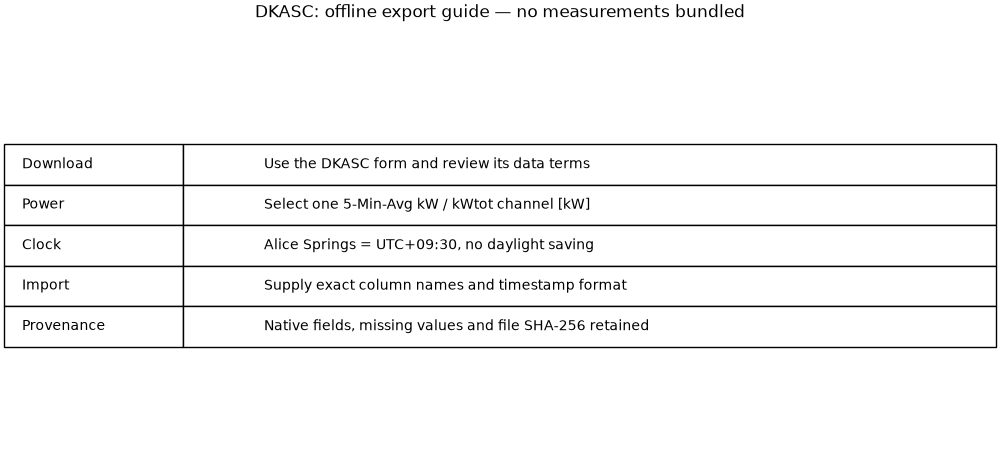
The Desert Knowledge Australia Solar Centre publishes measured PV array and weather data. Its download form requires user details and acceptance of the provider’s data terms. This connector imports the resulting native CSV. The default gallery shows an offline field guide, with no invented output.
After downloading an export, provide its exact columns and date format:
DKASC_CSV=/path/to/export.csv DKASC_SYSTEM='Your array' DKASC_TIME_COLUMN='Timestamp' DKASC_TIME_FORMAT='%Y-%m-%d %H:%M:%S' DKASC_POWER_COLUMN='Your array - 5-Min-Avg kW' uv run python examples/connectors/plot_generation_dkasc.py
Column names above are selections to replace with those in your file. The script
is included in the generation example bundle.
1. Choose an AC power column, not an accumulated energy register#
The official glossary defines
5-Min-Avg kW and 5-Min-Avg kWtot as average AC power in kW. kWh Del-Rec
is a cumulative meter reading. Keep total and phase channels separate to avoid
double-counting. Alice Springs uses UTC+09:30 throughout the year.
import os
from pathlib import Path

import matplotlib.pyplot as plt

from energy_data_retrieval.sources.dkasc import DKASCClient

export_path = os.environ.get("DKASC_CSV")
2. Execute a native-file import with exact field selection#
The importer retains the full original table and selected channel, records the input SHA-256, preserves missing/negative readings, and converts the explicitly parsed local timestamps to UTC. It does not resample or fill gaps.
if export_path:
    result = DKASCClient().read_export(
        Path(export_path),
        system_id=os.environ["DKASC_SYSTEM"],
        timestamp_column=os.environ["DKASC_TIME_COLUMN"],
        timestamp_format=os.environ["DKASC_TIME_FORMAT"],
        power_column=os.environ["DKASC_POWER_COLUMN"],
    )
    frame = result.frame
    fig, ax = plt.subplots(figsize=(10, 4), layout="constrained")
    ax.plot(frame.timestamp, frame.value, color="#c78423", linewidth=0.9)
    ax.set(
        title=f"DKASC: measured output of {frame.system_id.iloc[0]}",
        ylabel="Five-minute average AC power [kW]",
        xlabel="UTC (source time is UTC+09:30)",
    )
    print("Imported observations:", len(frame), "Input SHA-256:", frame.attrs["input_sha256"])
else:
    fig, ax = plt.subplots(figsize=(10, 4.5), layout="constrained")
    ax.axis("off")
    rows = [
        ["Download", "Use the DKASC form and review its data terms"],
        ["Power", "Select one 5-Min-Avg kW / kWtot channel [kW]"],
        ["Clock", "Alice Springs = UTC+09:30, no daylight saving"],
        ["Import", "Supply exact column names and timestamp format"],
        ["Provenance", "Native fields, missing values and file SHA-256 retained"],
    ]
    table = ax.table(cellText=rows, colWidths=[0.18, 0.82], cellLoc="left", loc="center")
    table.auto_set_font_size(False)
    table.set_fontsize(10)
    table.scale(1, 2.1)
    ax.set_title("DKASC: offline export guide — no measurements bundled", pad=20)
    print("Supply a downloaded native CSV to plot actual measured array output.")
plt.show()
Supply a downloaded native CSV to plot actual measured array output.
3. Attribute the provider and follow its redistribution terms#
DKASC data terms distinguish permitted small excerpts (at most 5,000 unaltered data cells) from larger redistribution requiring permission. Attribution and the provider’s disclaimer must accompany published data. No DKASC observations are bundled here, and the importer does not submit personal details or accept terms for you.
Total running time of the script: (0 minutes 0.065 seconds)