Note
Go to the end to download the full example code.
KGPV climate classification#
Classify five illustrative climate profiles using monthly temperature and precipitation plus annual irradiation. These are synthetic profiles, not observations at specific locations. The published twelve-zone mapping and fixed thresholds are described in the KGPV guide.
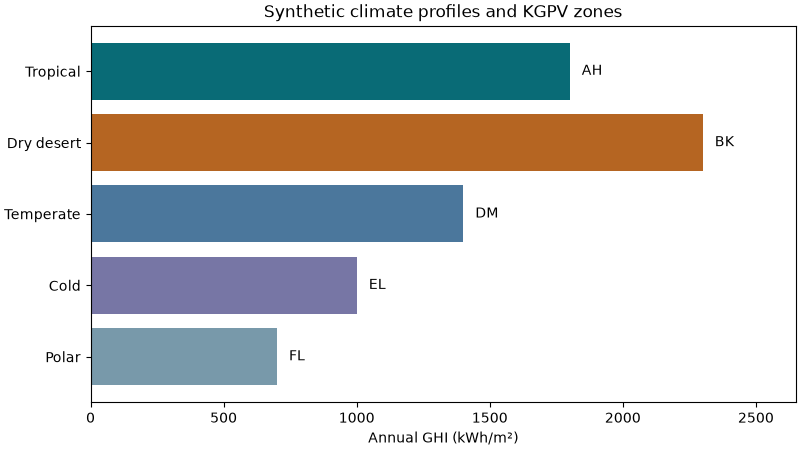
{'Tropical': np.str_('AH'), 'Dry desert': np.str_('BK'), 'Temperate': np.str_('DM'), 'Cold': np.str_('EL'), 'Polar': np.str_('FL')}
import matplotlib.pyplot as plt
import numpy as np

from energy_methods.kgpv import classify_kgpv

season = np.sin(2 * np.pi * (np.arange(12) - 2) / 12)
temperature = np.array(
    [26 + 2 * season, 25 + 10 * season, 13 + 10 * season, 2 + 17 * season, -15 + 10 * season]
)
rain = np.array([np.full(12, x) for x in (150, 2, 70, 50, 20)])
ghi = np.array([1800, 2300, 1400, 1000, 700])
result = classify_kgpv(temperature, rain, ghi, latitude=np.full(5, 40.0))
names = ["Tropical", "Dry desert", "Temperate", "Cold", "Polar"]

fig, ax = plt.subplots(figsize=(8, 4.5), layout="constrained")
bars = ax.barh(names, ghi, color=["#096b76", "#b56522", "#4b779c", "#7776a5", "#7899aa"])
ax.bar_label(bars, labels=[f"  {zone}" for zone in result.zone], padding=3)
ax.set(
    xlabel="Annual GHI (kWh/m²)", title="Synthetic climate profiles and KGPV zones", xlim=(0, 2650)
)
ax.invert_yaxis()
plt.show()
print(dict(zip(names, result.zone, strict=True)))
Total running time of the script: (0 minutes 0.066 seconds)