Note
Go to the end to download the full example code.
Chile’s largest solar plant: CEME1 module-count audit#
CEME1 is the largest operating solar entry by potencia_maxima in the
2026-10-31 CEN snapshot. Its operator also identifies it as Chile’s largest PV
plant. Registry maximum power (412.9326 MW) and DC nameplate (480.19 MWp) are
different quantities. The ranking does not add together separate projects.
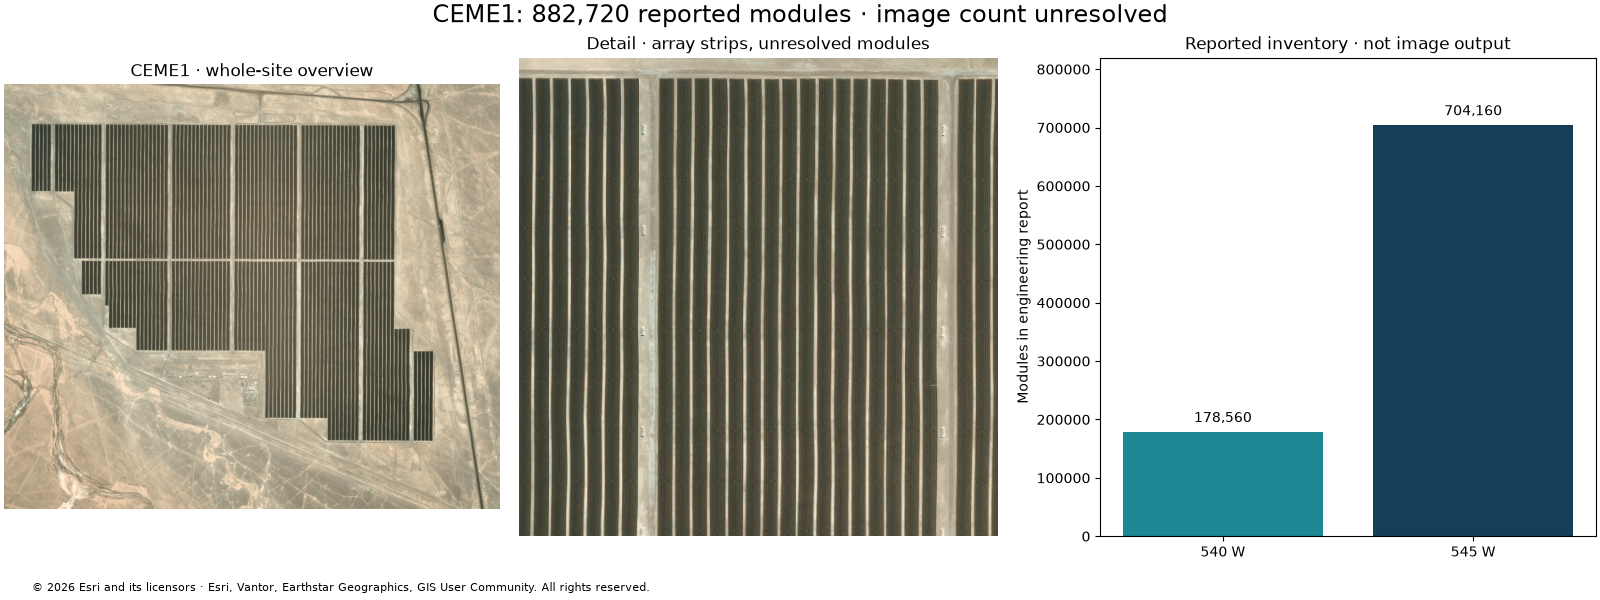
The engineering inventory is 882,720 modules. This example reproduces that inventory arithmetic and audits whether the imagery can independently count it. The automatic whole-plant image count remains unresolved. An overview or array-row count must not be presented as an individual-module count.
Download both offline Chile examples and audit exports. See the evidence and reproduction guide.
import json
from pathlib import Path

import matplotlib.image as mpimg
import matplotlib.pyplot as plt
import numpy as np

from energy_analysis.module_counting.chile import (
    audit_site_image,
    load_chile_study,
    verified_file,
)

HERE = Path(globals().get("__file__", Path.cwd() / "example.py")).resolve().parent
DATA = HERE / "data/chile_modules"
manifest, ranking = load_chile_study(DATA)
site = manifest["sites"]["ceme1"]
audit = audit_site_image(DATA, "ceme1")
inventory = site["reported_inventory"]
module_total = sum(group["modules"] for group in inventory["module_groups"])
assert (
    module_total == inventory["modules"] == inventory["strings"] * inventory["modules_per_string"]
)
dc_mwp = sum(g["modules"] * g["module_power_w"] for g in inventory["module_groups"]) / 1e6
print(
    f"Ranked {len(ranking)} operating solar entries "
    f"from {manifest['registry_source']['original_rows']} records"
)
print(f"Published inventory: {module_total:,} modules; rating sum: {dc_mwp:.4f} MWp")
print(
    json.dumps(
        {k: audit[k] for k in ("status", "image_candidate_count", "whole_plant_image_count")},
        indent=2,
    )
)
Ranked 757 operating solar entries from 1384 records
Published inventory: 882,720 modules; rating sum: 480.1896 MWp
{
  "status": "insufficient_source_sampling",
  "image_candidate_count": null,
  "whole_plant_image_count": null
}
1. Inspect the whole site and the available detail#
The diagnostic crop is only part of CEME1. The metadata probe reports 0.34 m source imagery, but the delivered basemap is sampled at 1.2 m at this site. A request for more pixels cannot recover the unavailable source detail. A 1.134 m module edge occupies less than one effective image sample, whereas the counter requires at least three samples per frame pitch. Counting is gated before detection to avoid interpreting wide array strips as individual modules.
fig, axes = plt.subplots(1, 3, figsize=(16, 6), layout="constrained")
overview = site["overview_capture"]
axes[0].imshow(mpimg.imread(verified_file(DATA, overview["filename"], manifest["sha256"])))
axes[0].set_title("CEME1 · whole-site overview")
axes[1].imshow(audit["rgb"], interpolation="nearest")
axes[1].set_title("Detail · array strips, unresolved modules")
for ax in axes[:2]:
    ax.set_axis_off()
groups = inventory["module_groups"]
axes[2].bar(["540 W", "545 W"], [g["modules"] for g in groups], color=["#1d8794", "#163e58"])
for i, group in enumerate(groups):
    axes[2].text(i, group["modules"] + 17000, f"{group['modules']:,}", ha="center")
axes[2].set(
    ylim=(0, 820000),
    ylabel="Modules in engineering report",
    title="Reported inventory · not image output",
)
axes[2].ticklabel_format(axis="y", style="plain")
fig.suptitle(f"CEME1: {module_total:,} reported modules · image count unresolved", fontsize=17)
fig.text(
    0.02,
    0.015,
    "© 2026 Esri and its licensors · Esri, Vantor, Earthstar Geographics, "
    "GIS User Community. All rights reserved.",
    fontsize=8,
)
fig.set_layout_engine("constrained", rect=(0, 0.06, 1, 0.94))
2. What would make a whole-plant count defensible?#
Obtain suitably licensed, georeferenced sub-metre imagery with visible module boundaries over the complete site. Review the as-built boundary and acquisition date, then process overlapping tiles with unique ownership of module centroids so seam detections are counted once. Validate held-out manual annotations and reconcile gaps, overlaps and partial tables before comparing with the report. Neither tiling, interpolation nor generative super-resolution restores absent optical evidence. The 882,720 reference never enters the image detector.
print(f"Effective sampling: {audit['effective_sampling_m']:.3f} m; minimum edge: 1.134 m")
print("Reported inventory check:", np.array([g["modules"] for g in groups]).sum())
plt.show()
Effective sampling: 1.329 m; minimum edge: 1.134 m
Reported inventory check: 882720
Total running time of the script: (0 minutes 0.352 seconds)